Finding Hidden Profit in Your Brand Analytics Dashboard
Read more
.png)
The Brand Analytics Repeat Purchase Behavior report shows which products customers buy again, revealing the repeat-buyer cohort most brands never act on.
Summarize in ChatGPT

Most Amazon brands optimize for the first purchase and stop there. They pour budget into winning a new customer, then quietly ignore what that customer does next. Amazon already tells you, in a report most sellers never open, which products turn a first-time buyer into a repeat one.
That report is Repeat Purchase Behavior, part of Brand Analytics, and the cohort it describes is the one most brands leave on the table. This guide covers what the report shows, why the repeat cohort matters, and how to turn its data into sharper PPC decisions.
It is a Brand Analytics dashboard that shows how often customers buy the same product again, available to brands enrolled in Brand Registry. Loyalty is its entire focus.
The report lives inside Amazon Brand Analytics, the aggregated search and purchase data available to registered brands. Among its dashboards, Repeat Purchase Behavior is the one built entirely around loyalty.
It sits alongside six other dashboards in the tool, from Search Query Performance to Market Basket Analysis, but where those describe discovery and demand, Repeat Purchase Behavior is the only one that describes what happens after the sale.
Access requires enrollment. You need a professional selling account and a brand registered through Brand Registry, which is the gate for every Brand Analytics report.
It is also one of the most underused reports in the tool. We cover the wider opportunity in our guide on finding hidden profit in Brand Analytics, and repeat behavior is the clearest example of data sitting unused.
A related dashboard, Customer Loyalty Analytics, segments buyers by how much they spend and how often, and the two read well together. Repeat Purchase Behavior tells you which products build loyalty, while the loyalty view tells you who your most valuable customers are.
One caveat to keep in mind: the data is aggregated and anonymized, so you see patterns, not individual customers. That is enough to shape strategy, but it means the report guides your bidding rather than building a customer list you can target directly.
Because acquisition is easier to measure and more exciting to chase, most brands optimize the first sale and never look at what happens after it. The reorder is invisible to the daily view.
The whole machinery of Amazon PPC points at acquisition. Keywords, bids, and ACoS all describe winning a click and a first order, so the repeat customer, who needs no ad to come back, falls outside the routine.
Part of the reason is where the data lives. Repeat Purchase Behavior sits in Seller Central, not the ads console, so a team focused on campaigns rarely crosses paths with it, and the two data sets almost never get connected.
There is also an attribution gap. PPC platforms credit the click that drove a sale, not the loyalty that follows, so the value a product creates after the first order never shows up in the campaign metrics a team watches daily.
That blind spot is expensive. The repeat cohort is where margin actually accumulates, because you already paid to acquire them once and every reorder after that is far cheaper.
Ignoring it also hides your best products. A SKU with a high repeat rate is a loyalty engine, and treating it like any other product means underinvesting in the thing that compounds.
It shows repeat ordered product sales and units, the number of repeat customers, and the percentage of repeat buyers, in a Brand View or an ASIN View. The numbers are simple and powerful.
The core metrics are the ones that describe loyalty directly. The report displays repeat ordered sales and units, how many customers bought more than once, and the share of repeat buyers out of everyone who ordered in the window.
The share of repeat buyers is the headline number. It is the percentage of customers in the window who bought more than once, and it is the single figure that separates a loyalty engine from a product people try once and forget.
You can view it two ways. A Brand View summarizes loyalty across your whole catalog, while an ASIN View breaks it down product by product, the same read-it-carefully discipline we teach for the Amazon SQP report.
Use the two views for different jobs. The Brand View tells you whether your catalog builds loyalty overall, while the ASIN View is where you find the specific products that do, which is the level real decisions get made at.
The date range matters more than it looks. Repeat behavior only appears over time, so a short window understates loyalty, and comparing the same window across periods is how you see a real trend.
Rank products by repeat rate, compare them against your average, and separate genuine loyalty drivers from one-time purchases. The leaders and laggards each tell you something.
Start by sorting ASINs by repeat rate. The products well above your catalog average are your loyalty drivers, and they deserve different treatment than the rest, much like the metric-by-metric read in our guide to Search Query Performance metrics.
Then ask why the leaders repeat. Consumables and habitual products naturally rebuy, but a durable product with a surprising repeat rate often points to gifting, multi-unit households, or a range worth expanding.
Read the laggards too. A product you expected to repeat but does not may have a quality, size, or experience problem, and that is a signal to fix the listing before you spend more, consistent with Amazon's own Sponsored Products best practices.
It helps to group products into loyalty tiers. A simple split into high, medium, and low repeat rates turns a long list into a plan, because each tier earns a different bid, budget, and level of protection.
Judge repeat rates against your own history, not an outside benchmark. What counts as a strong repeat rate varies widely by product type, so your trend over time is a far more reliable guide than any number published for a different catalog.
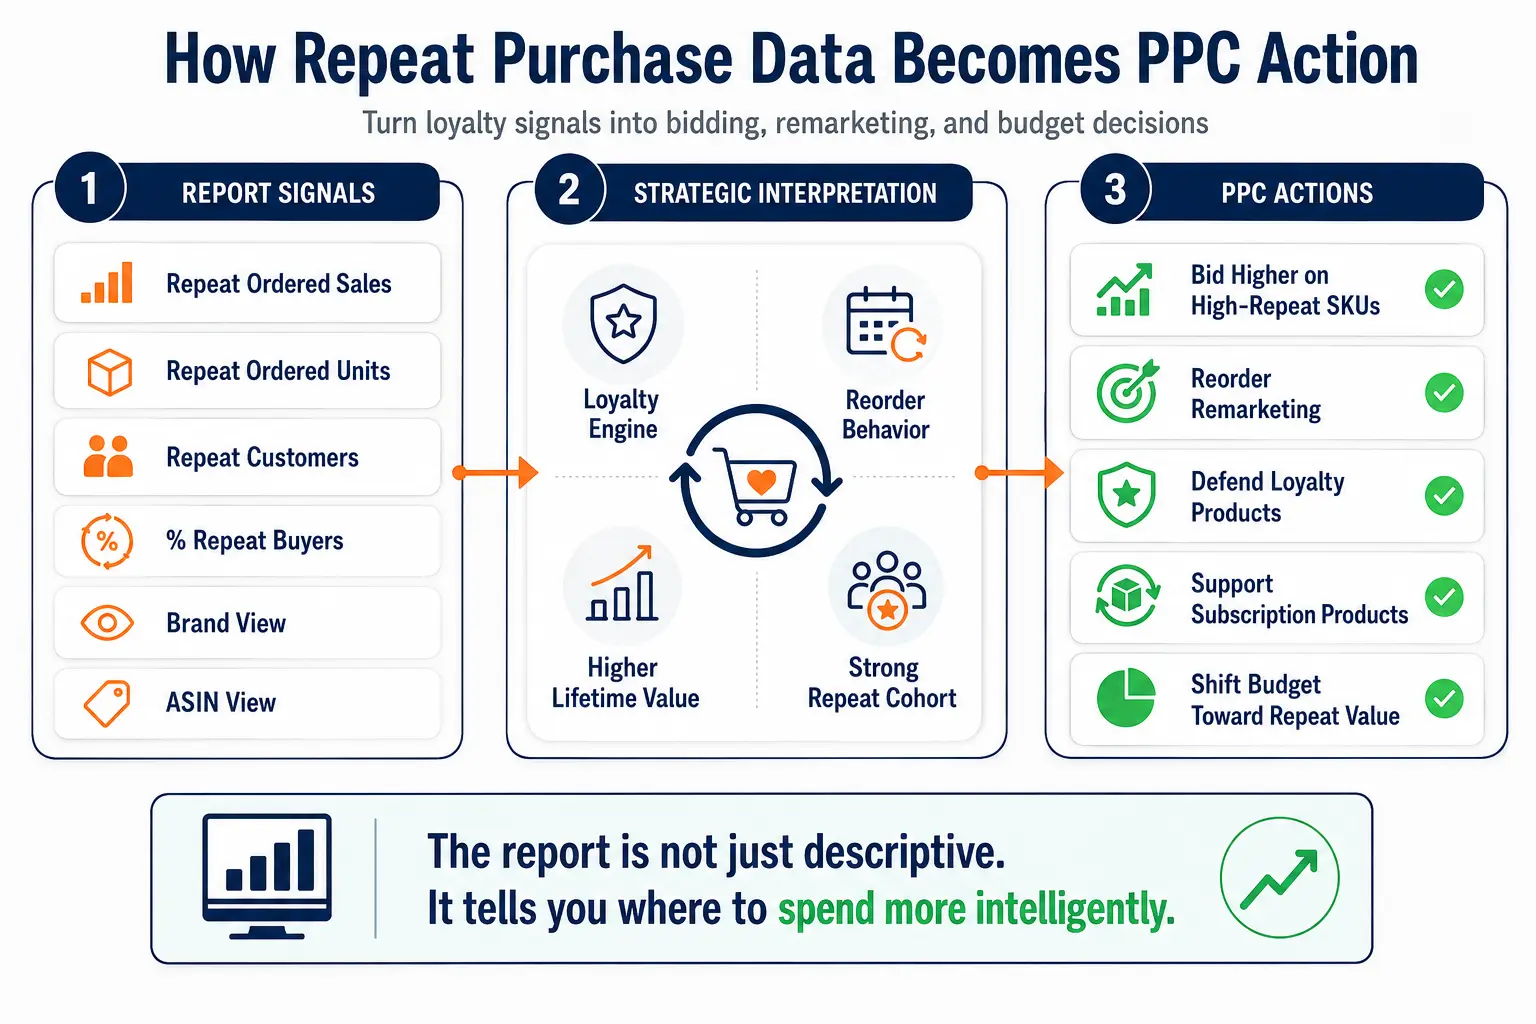
Bid to lifetime value on high-repeat products, remarket the cohort, and protect the SKUs that drive loyalty. The report tells you where to point each lever.
The first move is bidding. A product with a high repeat rate earns more than its first order, so it can carry a higher bid and ACoS on Sponsored Products than a one-time purchase can.
The second is remarketing the cohort. Sponsored Display reaches past buyers as they approach a reorder, which is some of the cheapest, highest-intent spend available on the platform.
The third is defending loyalty. Your highest-repeat products are worth protecting from competitors, which is where Sponsored Brands management earns its place, keeping rivals off the SKUs that compound.
For deeper cohorts, the analysis goes further. Amazon Marketing Cloud connects repeat behavior to the campaigns that acquired those customers, so you can spend more on the ads that create loyal buyers, not just buyers.
Repeat data also guides Subscribe and Save and new-to-brand focus. Products that already repeat are natural subscription candidates, and pushing them into recurring orders locks in the loyalty the report reveals, while new-to-brand metrics confirm you are still filling the top of the funnel.
The overall effect is a shift in where budget goes. Instead of spreading spend evenly, you weight it toward the products that create repeat customers, which is how a fixed ad budget starts producing more lifetime value from the same money.
It raises the acquisition cost a high-repeat product can carry, because lifetime value, not the first order, sets the real ceiling. One order is the wrong yardstick for a loyal product.
A first-order ACoS badly understates a loyal product. If a customer reorders three times a year, the value you can spend to acquire them is a multiple of that first sale, so a break-even set on one order leaves growth on the table.
A quick example shows the gap. If a product converts at a 30 percent break-even on one order but the average buyer purchases three times, the acquisition cost you can justify roughly triples. The report is what tells you which products earn that headroom.
This is why repeat-heavy categories bid differently. The economics are clearest in consumables, a pattern we develop in our guide on how pet brands scale past $100K a month, and the Repeat Purchase Behavior report is how you find that same pattern in your own catalog.
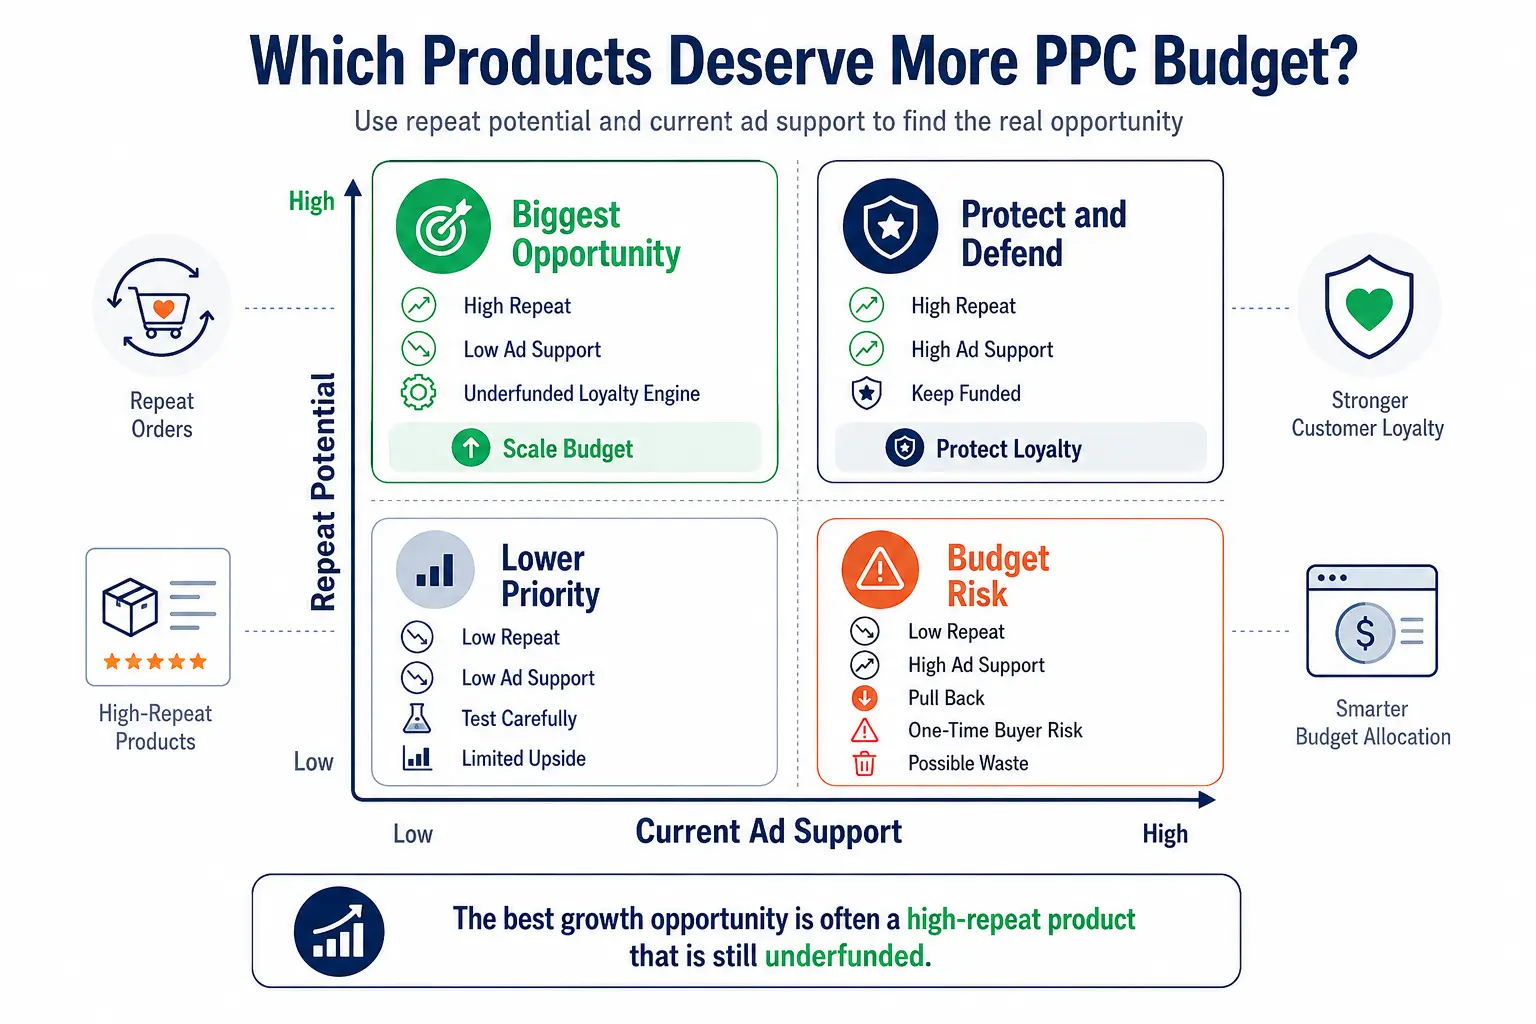
Look for products with a strong repeat rate but low ad support, because those are loyalty engines you are underfunding. The mismatch is the opportunity.
The most valuable finding in the report is that mismatch: a high repeat rate on a product you barely advertise. That is a loyalty engine running on organic demand, and modest, well-aimed spend often unlocks real growth.
The reverse is a warning. Heavy spend on a product with a poor repeat rate means you are buying one-time customers at full price, and that budget usually belongs on the SKUs that bring people back.
Repeat data also hints at range gaps. A product with strong loyalty often signals a customer who would buy adjacent items, so a high repeat rate is not just a bid signal, it is a prompt to widen the catalog around your winners.
Review it monthly for trends and quarterly for strategy, since repeat behavior moves slowly and overreacting to a single month adds noise. Patience is part of reading it well.
Monthly, watch whether your loyalty tiers are shifting and whether a product's repeat rate is rising or falling. That cadence is frequent enough to catch a change and slow enough to avoid chasing statistical noise.
Quarterly, use the report to reset bids, budgets, and defense across the catalog, and to decide which loyalty engines deserve more investment. Tie it to your incrementality and lifetime-value reviews so the whole account optimizes on the same picture.
The common mistakes are never opening the report, judging it on too short a window, and treating every product as if it repeats the same way. Each one wastes the insight sitting in the dashboard.
The first mistake is simply ignoring it, which is the default across most accounts.
The second is reading a window too short to reveal repeat behavior, so loyalty looks weaker than it actually is.
The third is applying one strategy across a catalog with very different repeat rates. A loyalty engine and a one-time product should not share a bid strategy, and the report is exactly what tells them apart.
A fourth mistake is reading repeat data in isolation. Pairing it with your campaign reports and market-basket data turns a single number into a decision, while the report alone only points in a direction.
As a specialist Amazon PPC agency, Amplivus reads the reports most brands skip, including Repeat Purchase Behavior, and turns loyalty data into bids, budgets, and defense that compound over time.
Day to day, that means disciplined Amazon PPC management that funds your loyalty engines and protects the cohort that makes them profitable.
If you want to see what your repeat data is already telling you, a free Amazon PPC audit surfaces the gaps, and a short Amazon strategy session turns them into a plan for the year.

Get a focused PPC review that uncovers underfunded loyalty SKUs, weak remarketing, and first-order bidding that limits lifetime value.
Use repeat-purchase data to fund loyalty engines, tighten weak SKUs, and bid to lifetime value instead of one sale.