The 10 SQP Metrics That Matter (And 7 That Don't)
Read more
.png)
Amazon Brand Analytics is a free Seller Central tool for Brand Registry sellers. Read each report as one profit decision: cut wasted ad spend, bundle products, and win lost conversions.
Summarize in ChatGPT

Most sellers treat Amazon Brand Analytics like a weather app. They glance at it, nod, and close the tab.
Meanwhile the same dashboard is quietly telling them which keywords drain their ad budget, which products people would happily buy together, and which competitor is catching the shoppers who almost bought from them.
The data is already yours. You paid nothing extra for it. The only thing standing between you and the profit inside it is knowing which number to read and what to do the moment you read it.
This guide walks through each report the way an audit does: open it, find the leak, fix it. No theory you cannot use by Friday.
Amazon Brand Analytics is a free set of dashboards inside Seller Central that shows how shoppers search for, compare, and buy your products. You reach it by logging in, opening the Brands menu, and selecting Brand Analytics.
There is no separate fee and no upsell.
Two conditions unlock it. You need a Professional selling account, and you must be a registered brand representative for a brand enrolled in Amazon Brand Registry.
If your brand is registered and you still cannot see the menu, your user permissions are usually the cause, not Amazon.
That free price tag is the part sellers underrate. You are looking at first-party shopper data that paid tools like Helium 10 and Jungle Scout often repackage and sell back to you.
The catch is that Amazon hands you the numbers and leaves the interpretation entirely to you.
When our team audits a new account, the first leak almost always sits in data the seller already had open access to. A keyword they kept bidding on that never converts.
A best-seller with an obvious bundle partner nobody set up. A loyal repeat-buyer segment that no campaign was speaking to.
The reports do not hide anything. They just present everything at once, with no flag that says "this line is costing you money." So the trick is not collecting more data.
It is assigning each report to one decision. Where do ad dollars go, which products get catalog support, and how do you price and position each item.
Read with that filter and the noise turns into a short list of moves.
A quick reality check on stakes: average Amazon ad cost of sale (ACoS) settled around 28% in 2026, and accounts running structurally higher than the mid-30s usually have fixable problems, not bad luck.
Brand Analytics is where you find which problem.
If you open one report, open this one.
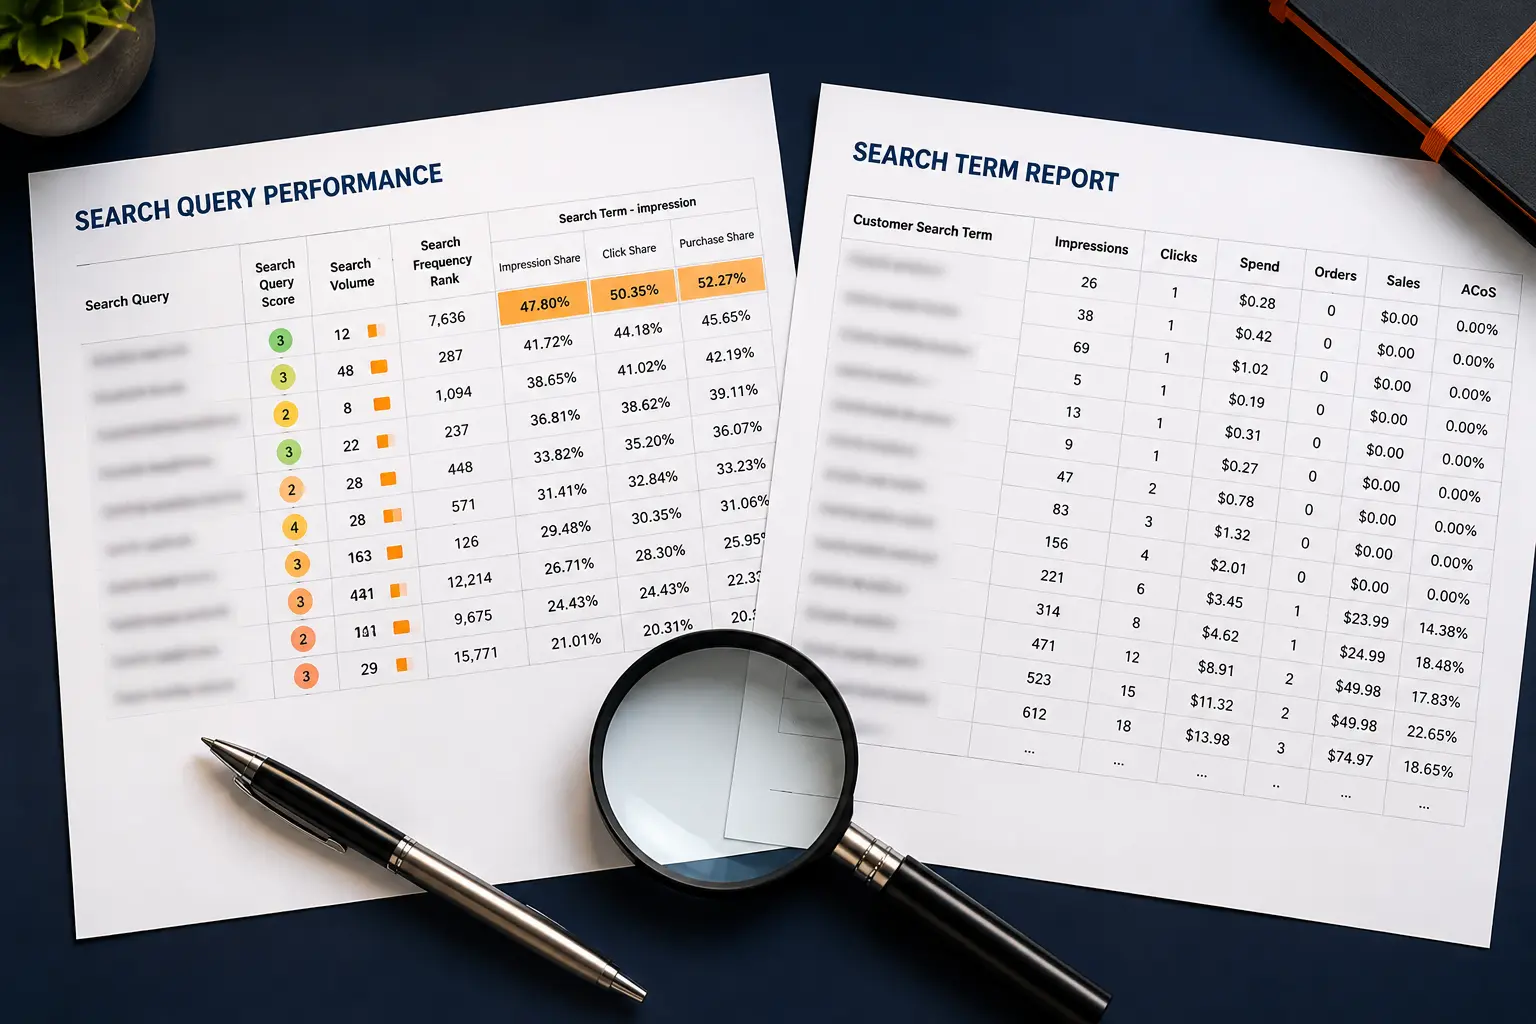
The Search Query Performance report shows the actual search terms shoppers used to find your brand, then breaks each term into a funnel: query volume, impressions, clicks, cart adds, and purchases.
It tells you not just what people searched, but where your product lost them.
Two numbers are easy to confuse.
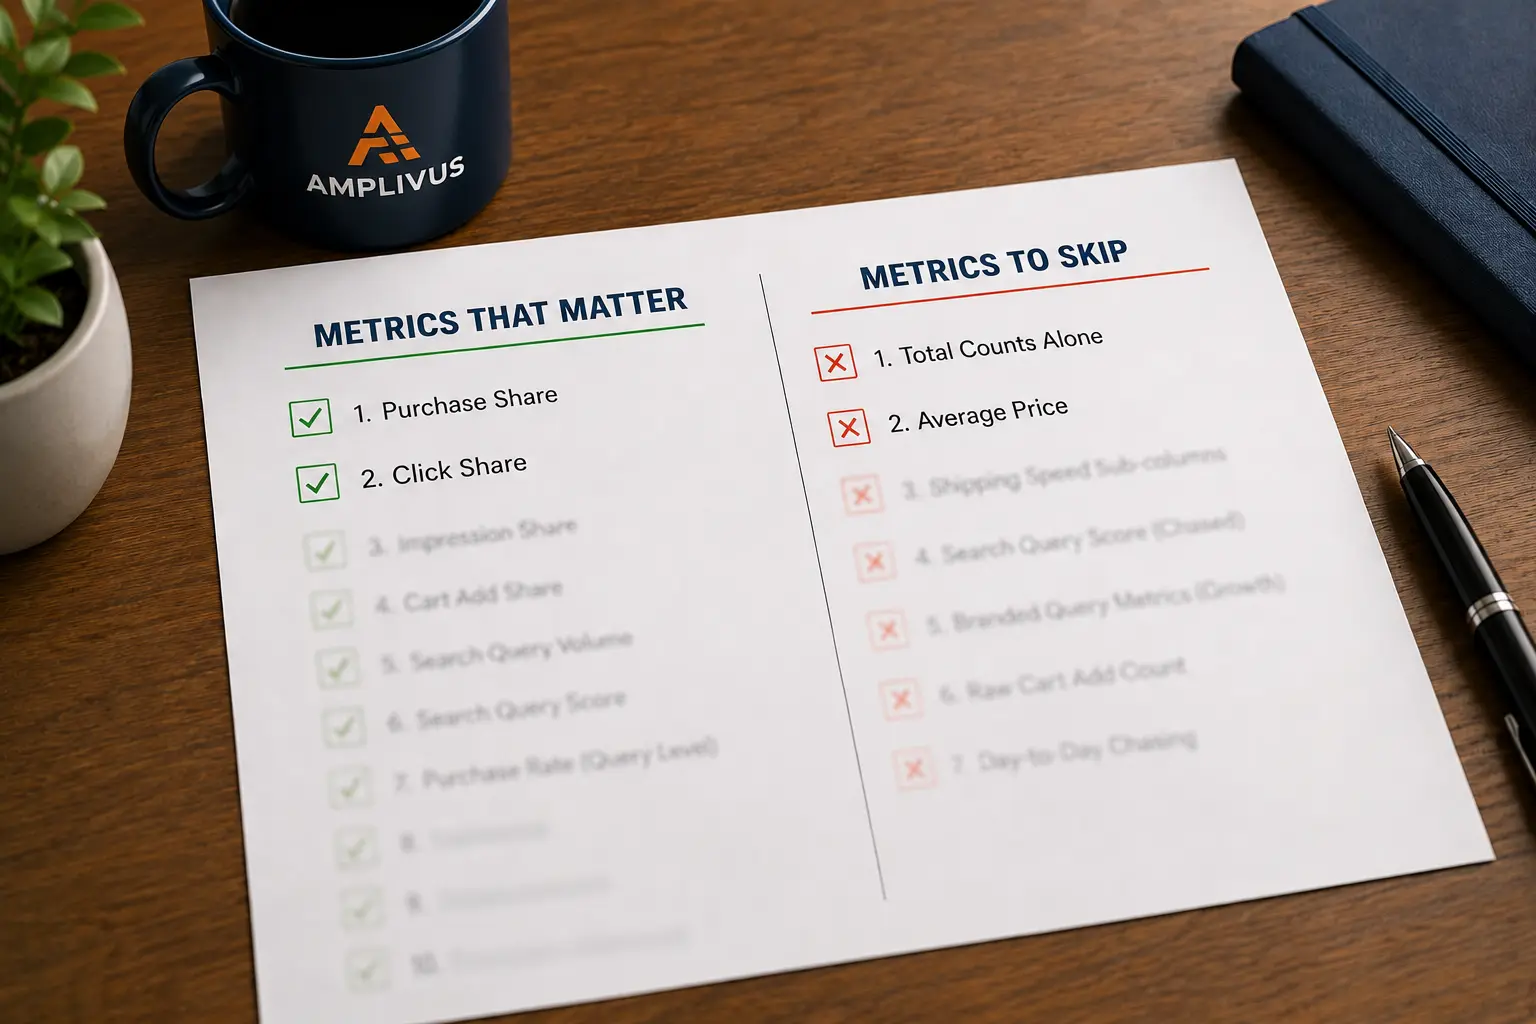
Search Query Volume is the raw count of times shoppers typed a term. Search Query Score ranks how important that term is to your brand relative to the market. A term can carry a modest volume but a high score because it converts well for you specifically.
Chase the score, not just the volume.
Here is the profit move.
Compare your click share to your conversion share for each term. When click share is high but conversion share lags well behind it, you are paying to pull shoppers in and then losing them on the listing.
That is a retail problem: price, images, reviews, or the offer. When click share itself is low, you have a visibility problem, and that is where bids and keyword targeting earn their keep.
Separating those two cases stops you from throwing ad spend at a page that simply needs a better main image.
Walk through a quick example so the numbers feel real.
Say a term shows 40,000 impressions, you hold a 22% click share, but only an 11% conversion share while the category sits near 20%.
Shoppers are clicking you at a fair rate and then choosing someone else at checkout. No bid change fixes that.
The work is on the page: a sharper main image, clearer title benefit, better price framing, or more reviews.
Now flip it.
A term where your click share is 6% but your conversion share is 28% is the opposite story.
People who reach you buy, you just are not getting in front of enough of them. That term deserves a higher bid and tighter keyword targeting, because every extra click is likely to convert.
Same report, two terms, two completely different decisions. That is the muscle worth building.
One honest caveat that most articles skip. This report uses a 24-hour attribution window, it does not count ad clicks, and it ignores shoppers who arrived straight at your product page from outside Amazon.
So treat it as a search-behavior report, not a full sales ledger.
A purchase only counts against a term when the whole journey from impression to checkout happens inside that single day, so a shopper who clicks today and buys tomorrow will show the click but not the sale.
Keep that in mind before you panic over a low conversion number on a considered, higher-priced product.
You can switch between Brand view and ASIN view, toggle monthly or quarterly, and export to CSV to work the numbers in a spreadsheet.
Newer to the dashboard and still missing from a lot of guides, the Search Catalog Performance report shifts the lens from the search term to your products.
It shows how each ASIN (Amazon Standard Identification Number) moves shoppers from impression to click to cart to purchase across all the searches that surfaced it.
Use it to spot the product that gets plenty of impressions and clicks but stalls at cart-add.
That stall pattern points at price perception or a weak offer, not traffic.
Pair it with Search Query Performance and you can tell, in minutes, whether a struggling ASIN needs a keyword fix or a listing fix. That single distinction is where a lot of wasted spend quietly lives.
The Market Basket Analysis report applies a retail technique market basket analysis has used for decades: it shows, for each of your ASINs, the top products customers most often buy in the same order. Sometimes the partner is your own product.
Often it is a complementary item, occasionally a competitor's.
The profit here is almost embarrassingly simple. If shoppers keep buying two of your items together, build a bundle listing, add a Sponsored Products campaign targeting one from the other, and capture the second sale you were already half-earning.
If the frequent pairing is a product you do not sell, you just found a roadmap for your next launch. Cross-sell revenue costs far less to win than a brand-new customer, which is exactly why it shows up first when we look for fast margin.
There is a second, sharper use most sellers miss.
When the report lists a competitor's product as a frequent co-purchase, that is a signal shoppers see your item and theirs as parts of the same job.
You can target that competitor ASIN directly with product-targeting ads, place your offer on their detail page, and pull a share of that demand.
Run the bundle play and the targeting play together and a single insight feeds both your catalog and your ad strategy at once.
The Repeat Purchase Behavior report counts how many of your orders come from new versus returning customers, treating an order as a repeat when the same customer buys again within 90 days.
It is the closest thing Brand Analytics gives you to a loyalty signal.
A healthy repeat rate means you can afford to spend more to acquire a first-time buyer, because that buyer is worth more than one order.
A flat repeat rate on a consumable (something people should reorder) is a flag that your follow-up, subscribe-and-save setup, or packaging insert is doing nothing.
New-to-Brand (NTB) metrics in your ad reports pair well here: NTB tells you the front door is working, repeat purchase tells you whether anyone stays.
This number quietly resets your whole ad math.
If you only ever look at the cost of the first sale, a keyword can look unprofitable when it is actually feeding a customer who reorders three times a year.
Knowing your repeat rate lets you read total advertising cost of sale (TACoS) the right way and defend keywords that build the customer base rather than cutting them on a single-order ACoS that tells half the story.
It is also the cheapest growth you own, because keeping a buyer almost always costs less than finding a new one.
These two are the competitor-steal reports. Item Comparison shows the products shoppers viewed in the same session as yours.
Alternate Purchase shows what they bought instead when they did not buy from you.
Read them like a scouting report.
A rival that keeps appearing is winning on price, reviews, images, or delivery speed, and the report tells you which battle you are losing without you guessing.
The move is targeted: defend with product-targeting ads on listings where you genuinely compete, sharpen the part of your listing they beat you on, and stop wasting effort on comparisons you cannot win.
This is also where you find the brands worth targeting in Sponsored Products and Sponsored Display.
The Top Search Terms report ranks the most popular searches on Amazon and shows the three products that win the most clicks and conversions for each.
It is your check on branded versus non-branded demand and a feeder for keyword harvesting: terms you should add to Sponsored Products, and terms you are over-paying for and should move to a negative-keyword list to protect margin.
The Demographics report breaks your customers down by age, income, education, gender, and household details.
Treat it as directional rather than gospel, but use it to sanity-check who you think your buyer is against who actually checks out. A mismatch often explains why a creative or a campaign underperforms.
If your listing images and copy speak to a 25-year-old buyer but the data shows your orders skew to households over 45 with higher incomes, that gap is costing you conversions, and the fix is free:
Rewrite the listing and refresh the ad creative (the Amazon Ads creative assets library is where you manage those images and logos) for the customer you actually have.
To see how this fits together, picture a small supplements brand.
Search Query Performance shows a flagship product winning clicks on its main keyword but converting below the category, so the team rewrites the title and swaps the lead image.
Search Catalog Performance confirms the same ASIN was stalling at cart-add, not at the click, which backs the listing fix over a bid change.
Market Basket flags a shaker bottle frequently bought alongside it, so they bundle the two and add a product-targeting campaign.
Repeat Purchase shows the powder reorders on a roughly 60-day cycle, so they push subscribe-and-save and stop judging that keyword on a single-order ACoS.
None of that required a new tool or a bigger budget. It came from four free reports read with one question in mind: what does this change?
You do not need to read every report every week. Sequence them.
Start with Search Query Performance and scan for the click-share-high, conversion-share-low terms (the retail leaks) and the low-click-share terms worth more bid.
Drop into Search Catalog Performance to confirm whether a weak product needs a listing fix or a traffic fix.
Check Market Basket once a month for new bundle pairs.
Review Repeat Purchase and Demographics quarterly, when the sample is large enough to mean something.
Pull Item Comparison whenever a competitor's pressure shows up in your sales.
Thirty focused minutes a week beats a three-hour data binge once a quarter, because the leaks are small and constant, and small constant fixes are what move total advertising cost of sale in the right direction.
The first is treating these reports as trivia instead of tying each one to a decision.
The second is acting on a tiny sample: a keyword with nine impressions tells you almost nothing, so wait for volume.
The third is reading Search Query Performance as a complete sales report and forgetting it misses ad clicks and off-Amazon traffic.
The fourth is cutting a keyword the moment ACoS looks high, before checking whether it drives New-to-Brand orders or assists other conversions.
And the fifth, the quiet one, is exporting everything and acting on nothing.
Data you do not turn into a bid change, a listing edit, or a bundle is just a tab you keep open.
If you sell a tight catalog and enjoy the numbers, this is absolutely a do-it-yourself skill, and this guide is enough to start finding money this week.
The honest line is different once the catalog grows.
When you are managing dozens of ASINs, the manual review stops scaling, the leaks multiply, and the cost of missing them outruns the cost of help.
That is the point where a second set of eyes pays for itself, whether that is a senior in-house analyst or an agency that does this daily.
If you want someone to read your dashboards with you, Amplivus runs a free Brand Analytics and Amazon PPC review and will show you the leaks before any conversation about working together.
Either way, the goal is the same: stop letting data you already own sit unread.
Stop guessing which metrics matter. We'll identify wasted ad spend, missed keyword opportunities, and conversion leaks in your account.
Most profit leaks are already visible in your data. Get a 24-hour Amazon PPC audit and uncover wasted spend and missed growth.

.png)
.png)


.png)
.png)