
How Amazon Brands Scale Past $100K/mo With PPC
Read more
.png)
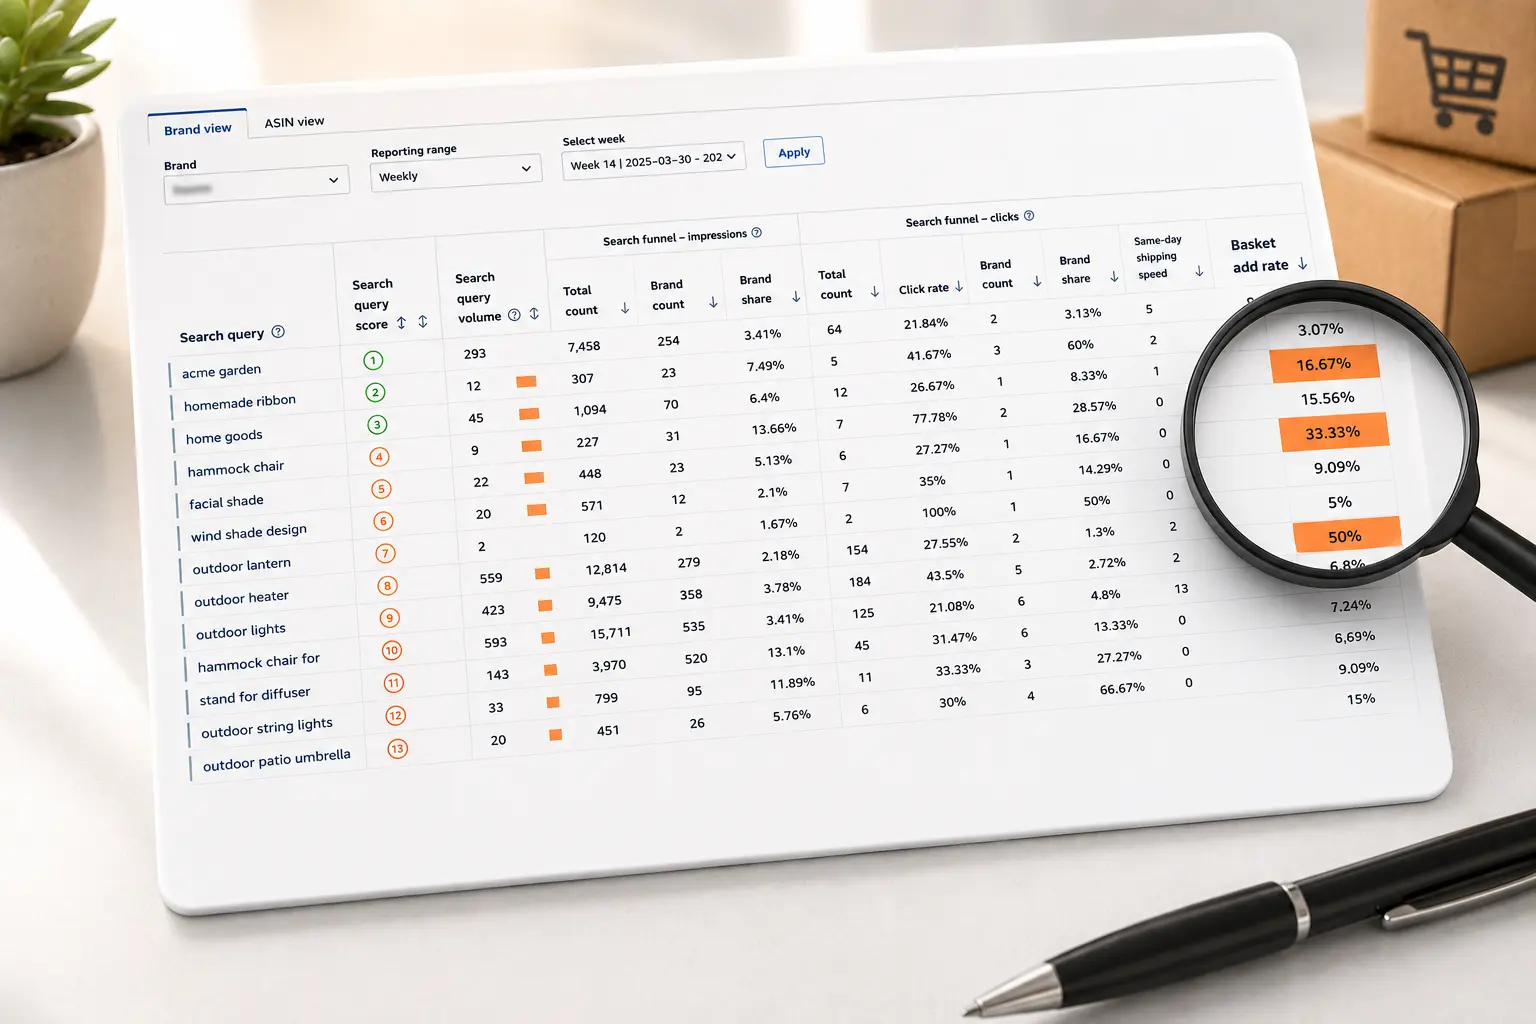
The Amazon SQP report shows your brand's share of impressions, clicks, cart-adds, and purchases per search term. Read purchase share first, then compare it to impression share to find gaps.
Summarize in ChatGPT
You opened the Search Query Performance report expecting answers.
Instead you got a spreadsheet with more columns than a tax form and a thousand rows of search terms, each one wearing four or five percentages.
Somewhere in there is the reason your sales moved last month.
Good luck finding it before lunch.
Here is the part nobody tells you: most of that report is noise on any given day. You do not need to read every cell.
You need a short, repeatable scan that pulls three or four decisions out of the mess and lets you close the tab.
That is what this guide gives you. No glossary marathon, no "it depends" hand-waving.
A read-this-first order, real thresholds, the quirks that quietly fool people, and a worked example that ends in an actual change to your account.
Search Query Performance (SQP) is the query-level report inside Amazon Brand Analytics, and Search Catalog Performance is its ASIN-level counterpart.
That one sentence saves a lot of confusion, so read it twice.
SQP answers "how did this search term perform for my brand," while Search Catalog Performance answers "how did this product perform across the terms people used."
You reach it in Seller Central under Brands, then Brand Analytics, then Search Analytics, then Search Query Performance.
It is gated behind Amazon Brand Registry, so if you do not own a registered brand, you will not see it.
The data refreshes weekly, and you can also pull it monthly or quarterly, which matters later when you decide how often to look.
One more piece of context.
In February 2025, Amazon added Search Query Performance and Search Catalog Performance report types to the Selling Partner API, so tools and agencies can now pull this data programmatically instead of clicking through the dashboard every week.
If your team has outgrown manual exports, that is the door.
Amazon shows the search funnel as four stages, and SQP reports your share of each one for a given query.
Think of share as your slice of everything that happened on that search term, not a raw count of your own activity.
Impression share is the percentage of all impressions for that query that your products earned.
It answers: when people search this, how often do they even see me?
Click share is your slice of the clicks. People saw the results and chose where to click. Did they pick you?
Cart-add share is your slice of the add-to-carts. Interest turned into intent. Did it happen on your listing?
Purchase share is your slice of the actual purchases for that query. This is the money line.
Alongside those, two columns set the stage. Search query volume tells you how many times the term was searched, so you know whether a row is worth your attention at all.
Search query score ranks the queries by how much they drive your sales, not by how often they are searched, which is why a low-volume term can sit near the top.
You will see dozens of other columns. Ignore them on the first pass. The four shares and the volume are the spine of the report.
This is the part the other guides skip. When you open the export, do not start at column A and read right. Start here, in this order:
You are only going to look at terms with enough traffic to matter. A term searched eleven times a week is rounding error.
This is your real share of sales on that query. A strong purchase share on a high-volume term is money in the bank. A weak one is your biggest opportunity or your biggest leak.
This single comparison is the most useful read in the whole report.
If impression share is high but purchase share is low, shoppers see you and skip you: a listing, price, review, or image problem.
If impression share is low but purchase share is high, you convert beautifully but barely show up: an advertising and ranking opportunity.
Chase that gap.
If you lose people between impression and click, your main image, title, price, or star rating is the suspect.
If you lose them between cart-add and purchase, it is price, shipping, or competition closing in at checkout.
Sixty seconds, four reads, and you already know whether each important term is a win to defend, a leak to fix, or a gap to attack.
Everything else in the report is detail you reach for only when one of these four reads raises a question.
This is where careful people still get burned, because the numbers look authoritative.
The 24-hour attribution window.
SQP counts a purchase against a query only if the entire trip, from the search impression to checkout, happens inside one 24-hour window.
Someone searches "cast iron skillet" Monday, adds to cart, and buys Tuesday morning? Monday's report shows the click and the cart-add but not the purchase.
That is not a bug.
It means SQP purchase counts run lower than reality for any product people mull over.
Long-consideration items are affected most.
SQP will never match your Seller Central sales report.
Because of that window, and because SQP is query-attributed rather than order-attributed, the totals do not reconcile.
Do not waste an afternoon trying to tie them out. SQP is a directional view of search behavior, not your bookkeeping.
Impression share has a per-ASIN ceiling.
A single product can only capture so much of a query's impressions, so a "low" impression share on a broad head term is often normal, not a failure.
Judge impression share against the query's breadth, not against 100 percent.
Knowing these three keeps you from the classic mistakes: panicking over a purchase-share dip that is really a slow-buying category, and chasing impression share on a term no single product can own.
Amazon mixes branded searches (your name in the query) and non-branded searches (generic terms) in the same export, and it will not sort them for you.
This matters because branded terms almost always show high click, cart-add, and purchase share. Of course they do, people searching your brand already want you.
Leave them in the pile and they inflate your averages and hide the truth about the generic terms that actually grow the business.
The fix is a two-minute spreadsheet move. Export the report, add a column, and flag every row whose query contains your brand name or common misspellings of it.
Filter those out (or analyze them separately if you are measuring brand defense).
Now read the non-branded rows on their own. That is your real competitive picture: how you perform when the shopper has no loyalty yet.
Almost every "my conversion looks fine" illusion dies here, and that is a good thing, because it points you at the work that moves rankings.
Every seller wants a magic number, and every honest operator has to caveat it, so here is both.
As a working rule of thumb, on a non-branded term where you have real presence, a purchase share that meaningfully beats your impression share means you punch above your visibility, which is healthy.
A purchase share well below your impression share on a high-volume term is the clearest "fix this" signal in the report.
On branded terms, expect high shares across the board; anything soft there suggests a competitor is conquesting your name.
Now the caveat the SERP avoids: there is no universal "good purchase share," because category structure changes the math.
A query ruled by one giant brand caps everyone else's possible share.
A fragmented category spreads it thin. So read your numbers against the spread of the query, against your own trend week to week, and against the gap between your funnel stages, not against a number you saw in a blog post.
Movement and gaps tell you more than absolutes ever will.
Say you sell a stainless steel pour-over coffee kettle. You open SQP, sort by volume, and look at three terms.
"gooseneck kettle" has high volume. Your impression share is 22 percent, click share 18 percent, cart-add share 16 percent, purchase share 9 percent.
Read it: you show up and get clicked, then bleed out between cart-add and purchase.
People are comparing you at the last step and picking someone else. The likely culprits are price and review count at checkout, not your image.
Action: check competitor pricing on that term, consider a coupon, and push for more reviews. Do not pour more ad spend onto a term that leaks at the bottom.
"pour over coffee kettle" has solid volume. Impression share 6 percent, but purchase share 14 percent.
Read it: when people find you, they buy, but you are nearly invisible.
Action: this is a harvest. Add it as an exact-match keyword in Sponsored Products, bid up, and watch your organic rank follow the sales velocity.
"electric kettle" shows up with decent volume and a purchase share near zero.
Read it: wrong shopper. Your kettle is stovetop, these searchers want electric.
Action: add "electric" as a negative keyword in your campaigns so you stop paying for clicks that will never convert.
Three terms, three different moves: fix a listing, harvest a winner, negate a mismatch.
That is what reading SQP is supposed to produce. Not a prettier spreadsheet, a shorter to-do list.
SQP is most powerful when it feeds your advertising.
The gap reads above translate cleanly into Sponsored Products decisions: harvest the high-converting, low-visibility terms into exact-match keywords; negate the high-impression, zero-purchase mismatches; and raise bids where your purchase share already beats your impression share, because the algorithm is telling you that term is yours to win.
You can act on all of it from the Amazon Ads Console or Seller Central.
On the organic side, the impression-to-click drop is a listing brief in disguise.
A weak click share on a high-impression term points at your main image, title, price, or star rating. A weak purchase share after a strong cart-add share points at price, shipping, or a competitor's offer.
SQP does not just measure your listing, it tells you which line to rewrite first.
You do not need to live in this report. Once a week, export it, flag and filter your branded terms, sort the non-branded rows by volume, and run the 60-second scan on your top ten to fifteen queries.
Write down anything where purchase share and impression share diverge sharply. Turn those into three or four moves: a bid change, a negative keyword, a listing tweak. Close the tab. Next week, check whether last week's moves shifted the shares.
That feedback loop, not heroic deep-dives, is how SQP compounds into ranking and revenue over a quarter.
Reading SQP well is not hard, but it is tedious, and tedious is exactly what gets skipped in a busy week.
If you would rather see the three moves than build the spreadsheet, Amplivus will review your Search Query Performance data and hand you a prioritized action list: the terms to harvest, the keywords to negate, and the listings to fix first.
Request a free SQP and PPC review from Amplivus, and we will turn your next export into decisions, not anxiety.
Stop guessing which search terms matter. Get a prioritized action plan showing what to harvest, negate, and optimize first.
Discover which search terms to scale, negate, or optimize with a data-backed Amazon PPC review.


.png)
.png)


.png)
.png)