SQP Cart-Add-to-Purchase Drop-Off: A Diagnosis Guide
Read more
.png)
SQP reports your share at every funnel stage, so mapping impression, click, cart-add, and purchase share shows exactly where you lose ground to the market.
Summarize in ChatGPT
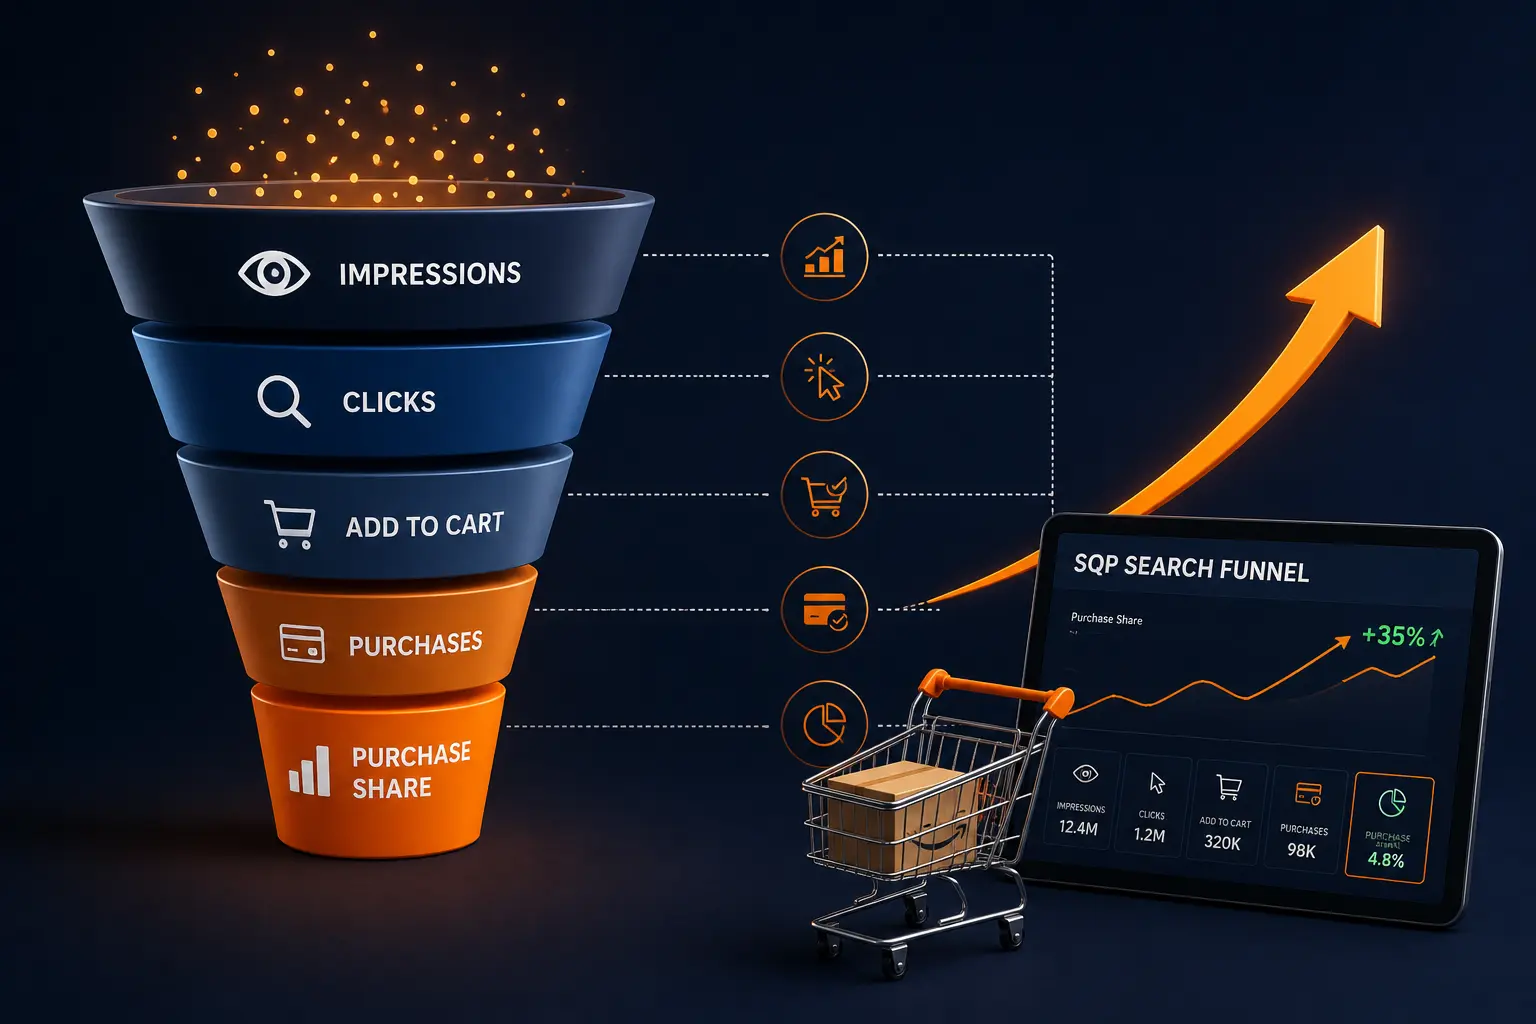
Most sellers read the Search Query Performance (SQP) report one column at a time and miss its real power, which is that it maps a funnel.
For any search term, SQP shows your share of the query's impressions, then clicks, then cart adds, then purchases, and the way that share changes from one stage to the next tells you precisely where you win and where you lose.
A product can hold a strong impression share and then bleed it away at the click, or convert clicks into cart adds well but lose them at checkout. Read as separate numbers, those columns are noise.
Read as a funnel, they are a diagnosis, because the stage where your share falls the most is the stage costing you the most sales.
This guide shows you how to map that funnel from impression share to purchase share, read the drop between each stage, and localize the leak so you fix the right thing.
It assumes you know the report's layout; if you do not, start with our guide on how to read the Amazon Search Query Performance report, then use this to turn the columns into a map.
The report tracks a shopper's path through four stages, and reports your share at every one, which is what makes the funnel readable.
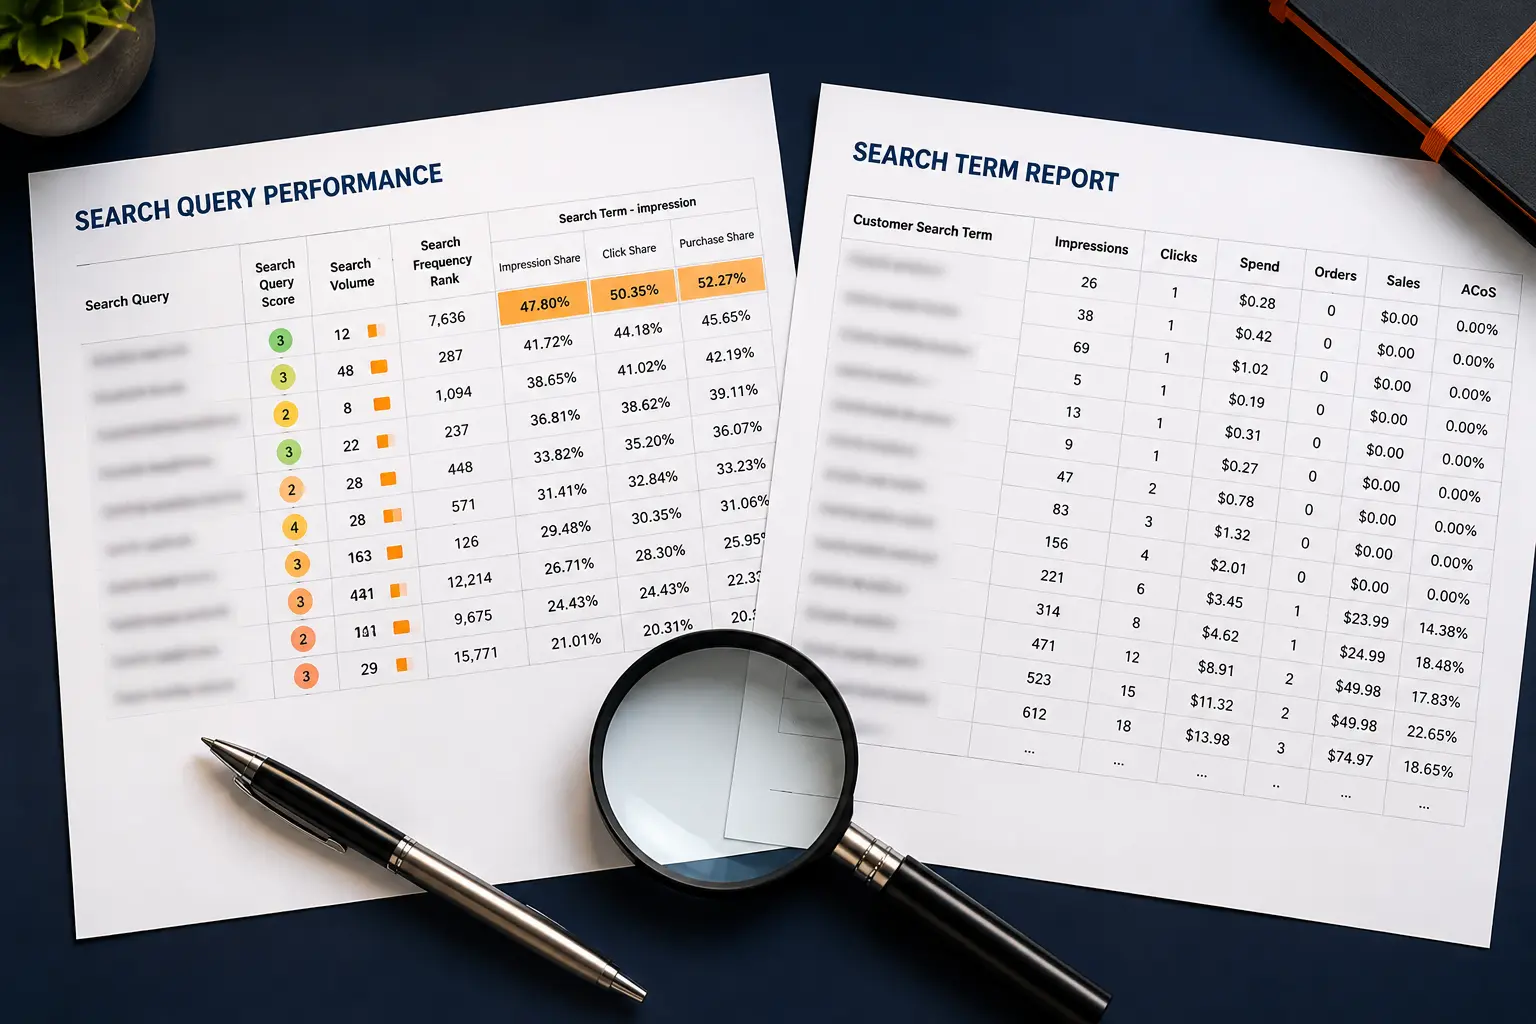
For each query, SQP reports total volume and your share at four points: how often products appear (impressions), get clicked, get added to cart, and get purchased.
Your share at each stage is your slice of that query's activity against every competitor on the term. Amazon's Brand Analytics and Search Query Performance is where these figures live, available once you enroll in Brand Registry.
The point of pulling all four is not to read them separately but to line them up, because a funnel is only visible when you see the whole chain at once.
Raw counts tell you how big a query is; share tells you how you perform on it.
If your clicks fell but your click share held, the query simply got smaller, which is a different problem from your click share dropping while the query held steady.
Share normalizes for the size and seasonality of the term, so it isolates your performance from the market's noise.
That is why funnel mapping works on share: comparing your impression share to your purchase share on the same term shows whether you convert attention into sales better or worse than the field, which no count can tell you.
The full set of share and rate metrics is covered in our guide on the search query metrics that matter most.
Mapping the funnel means looking at how your share changes from one stage to the next, because each transition has its own meaning.
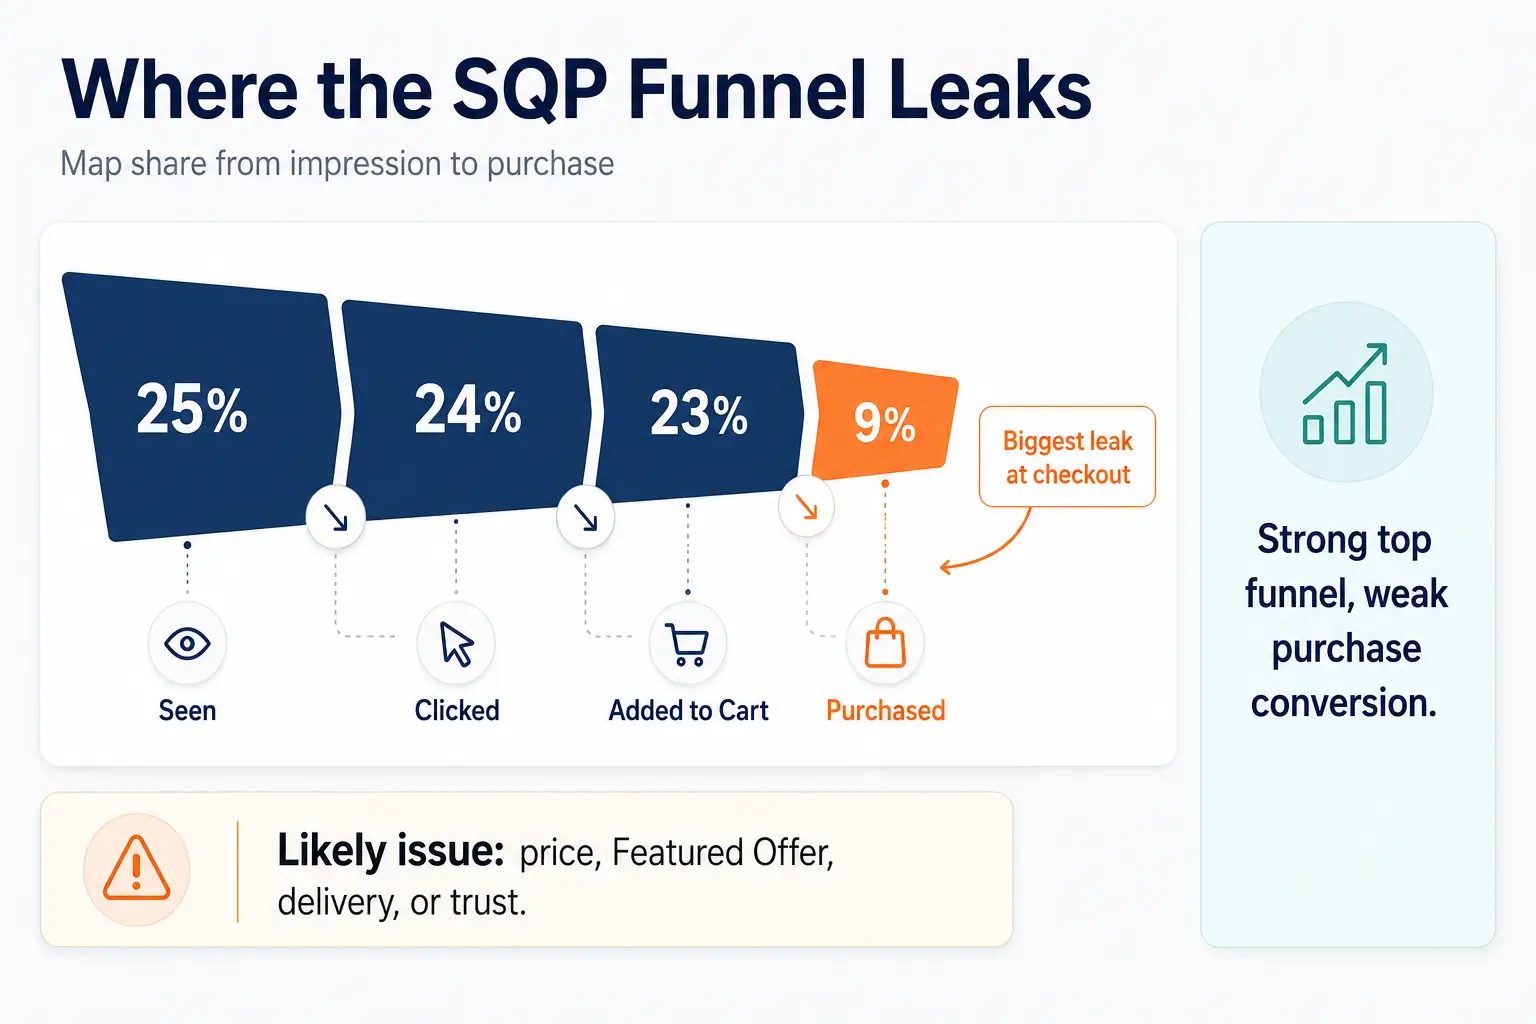
Line up your four shares for a query and look for the biggest drop.
If your impression share is healthy but your click share is much lower, you are seen but not chosen, a click-stage leak. If click share holds but cart-add share falls, shoppers engage but hesitate on the listing.
If cart-add share is strong but purchase share drops, they intend to buy but abandon at the last step.
The largest stage-to-stage fall is your primary leak, and it points at a specific cause rather than a vague sense that sales are soft. Mapping turns soft into specific.
A worked example makes it concrete. Say for a core term you hold 25 percent impression share, 24 percent click share, 23 percent cart-add share, and 9 percent purchase share.
Three of the four stages are holding, and the whole story is in the last one: you win attention, clicks, and intent at a quarter of the market, then lose two-thirds of it at checkout.
No amount of new visibility fixes that; the money is in the purchase stage, and the diagnosis is price, the Featured Offer, delivery, or trust.
Contrast that with a product at 8 percent impression share but 22 percent purchase share, which converts beautifully and simply is not seen enough, so the fix is reach, not the listing.
Same report, opposite conclusions, and only the funnel map tells them apart.
There is a second read: compare your share at the bottom to your share at the top.
If your purchase share is higher than your impression share, you punch above your visibility, converting attention into sales better than the field, so the opportunity is more visibility.
If your purchase share is lower than your impression share, you get seen more than you sell, so the opportunity is conversion.
That single comparison tells you whether to spend on being found or on converting what you already reach, which is one of the most useful strategic reads in the whole report.
It also stops two common and opposite mistakes: pouring budget into visibility for a product that cannot convert what it already gets, and neglecting the reach of a product that converts better than anything else you sell.
Knowing which of those describes each term is worth more than any single-stage metric.
Once the map shows where the leak is, each stage points to its own set of causes and fixes.
If your impression share is weak, shoppers are not seeing you for the term, which is a relevance and reach problem.
The listing may not be relevant enough to the query in its title and backend terms, or your organic rank and paid coverage may be thin.
The link between relevance, sales velocity, and being surfaced is covered in Amazon's own guidance on search rankings, and the practical response is twofold.
First, improve relevance so Amazon surfaces you organically, by making sure the query's language appears where it counts in your title, bullets, and backend terms.
Second, buy the visibility you lack while that rank builds, using Sponsored Products and Sponsored Brands to close the impression-share gap on the terms that matter.
A low impression share is the one leak you can partly solve with spend, but only if the listing is relevant enough to convert the visibility once you buy it.
If you are seen but not clicked, the decision happens in the search results before the shopper ever reaches your listing, so the levers are the ones visible there: your main image, your title, your price, your rating, and your review count.
A weak main image or a price far above the market median for the term is the usual culprit, because shoppers filter on those in a glance.
Fix what shows in the results grid first, since no listing change helps a shopper who never clicks.
This stage is where a lot of budget quietly dies, because a seller with a click-share leak often responds by bidding higher, which buys more impressions the shopper still does not click.
The impressions cost money and the clicks never come, so the ACoS climbs while sales stay flat, and the seller blames the campaign when the real problem was the thumbnail or the price.
Mapping the funnel catches this early: a healthy impression share paired with a weak click share is a clear signal to fix the storefront-facing elements before touching a single bid, because the leak is upstream of everything the campaign can control.
If clicks convert to cart adds poorly, shoppers reach your listing but are not convinced enough to add it, which points at the detail page: the secondary images, the bullets, the A+ Content, the reviews, and the fit between the query and what you actually sell.
This is where a mismatch between the search term and your product shows up, and where weak proof loses a considering shopper. Strengthen the page so it answers the question the query implies.
Query-to-product fit deserves special attention here, because it is a leak that looks like a listing problem but is really a targeting one.
If a term brings clicks that never add to cart, the shoppers arriving may simply want something adjacent to what you sell, a different size, feature, or use case, and no amount of listing polish converts a shopper who wanted a slightly different product.
In that case the fix is not the page but the term: reduce spend on the mismatched query and redirect it to the ones your product actually satisfies.
The cart-add stage is where you learn the difference between a listing that underperforms and a keyword that was never right for you, and the map is what surfaces the distinction.
If cart adds do not become purchases, shoppers intend to buy but abandon, and the causes cluster around price, the Featured Offer, shipping, and last-moment trust.
A price that looks fine until checkout, a lost Featured Offer, slow delivery, or thin reviews can all break the final step.
This specific transition is common enough to deserve its own analysis, which our guide on the cart-add to purchase drop-off in SQP breaks down in full, and the price side of it connects to our guide on reading click price trends in your SQP report.
The value of funnel mapping is that it tells you where to spend your limited attention, so the workflow is worth doing deliberately.
For your priority keywords, pull the four share figures, line them up as a funnel, and note the biggest stage-to-stage drop on each.
Rank your terms by where a fix would move the most revenue, which is usually a high-volume query with a large drop at a single stage.
Do not try to fix every stage on every term; the map exists precisely so you can concentrate on the one leak that matters most on the terms that matter most.
That focus is what turns a sprawling report into a short action list, and maintaining it over time is the kind of ongoing discipline a structured Amazon PPC management practice is built to hold.
Your funnel does not exist in a vacuum; the share you lose goes to someone. When your click share drops on a term, a competitor is winning those clicks, and understanding who and why sharpens the fix.
Layering the funnel map over competitive data shows whether you are losing to a cheaper price, a stronger image, or a better-reviewed rival, which is the kind of read a structured Amazon PPC competitor analysis is built to produce.
The map tells you which stage leaks; the competitive read tells you why.
Funnel mapping rewards patient, structured reading, and that is exactly what a busy operator rarely has time for: pulling the four shares across every priority term, ranking the leaks by revenue impact, and connecting each drop to its cause and its fix.
Done well, it turns a wall of numbers into a short, ranked list of the changes that will move the most sales.
That is a specific, findable set of opportunities, and it usually points to fixes that move real revenue rather than cosmetic tweaks.
As a specialist Amazon PPC agency, Amplivus maps the search funnel and ties each leak to the fix, reading share and competition together rather than in isolation.
A free Amazon PPC audit shows where your funnel leaks most, and a short Amazon strategy session maps the highest-impact fixes to make first.

Stop guessing where shoppers drop off. Find the SQP stage leaking the most share and get a clear action plan to recover lost sales.
Book a strategy call to review your SQP funnel, identify the biggest leak, and map the fixes most likely to lift sales.
.png)
.png)


.png)
.png)