
SQP Report vs Search Term Report: When To Use Each (2026)
Read more
.png)
Cart-add-to-purchase drop-off in Amazon SQP means shoppers add your product but never complete checkout. The cause is usually price, stock, reviews, Featured Offer loss, or page issues.
Summarize in ChatGPT

A high cart-add column with a sinking purchase column is the most misread signal in Amazon Brand Analytics.
It looks like a near-win. It usually means money is leaking at the last step, and most sellers fix the wrong thing first.
This guide is for brand owners, PPC managers, and agency analysts who already live inside the Search Query Performance report and want a repeatable way to find the single cause of the gap.
Here is the warning that saves the most money: do not touch price first. Price is the easiest lever to pull and the most common overcorrection.
Half the time the real problem is a lost Featured Offer (Buy Box) or a stock issue that a price cut will never fix.
We will define the rate, name the five causes, and walk an ordered diagnosis you can run this afternoon.
Cart-add-to-purchase drop-off is the share of shoppers who add your product to cart on a given search query but do not complete the purchase.
In the Search Query Performance report, you read it by comparing your cart add share to your purchase share for the same query.
The working formula is simple.
Cart add to purchase rate = purchase share ÷ cart add share, at the query level.
When purchase share sits well below cart add share, you have a drop-off. When the two move together, your funnel is healthy and the issue is upstream in clicks or impressions instead.
Search Query Performance is the Brand Analytics report that tracks the full funnel for your most relevant keywords: impressions, clicks, cart adds, and purchases, each broken out by search term.
It exists in two views, an ASIN view and a brand view, so you can move from a single product up to the whole catalog.
Think of it as a conversion funnel sliced by query. Each stage hands off to the next, and a drop-off tells you exactly where the handoff breaks.
Impressions to clicks is a relevance and main-image problem.
Clicks to cart adds is a detail-page interest problem.
Cart adds to purchases, the stage this guide covers, is almost always a price, availability, or trust problem at the final decision.
What counts as a healthy purchase rate depends entirely on category.
Across Amazon, listing conversion (unit session percentage) tends to run far higher than open-web retail, often in the 10 to 15 percent range, while consumables can sit higher and considered electronics lower.
Use your own category as the benchmark, not a single internet average.
The wider e-commerce world reports cart abandonment near 70 percent, but that figure comes from multi-step open-web checkouts, not Amazon's one-click flow, so treat it as context rather than a target.
Amazon strips out most of the friction that drives that number off-platform: no surprise shipping reveal, no forced account creation, no slow payment form.
That is why pasting the open-web 70 percent figure into an Amazon diagnosis (as several ranking pages do) is a category error.
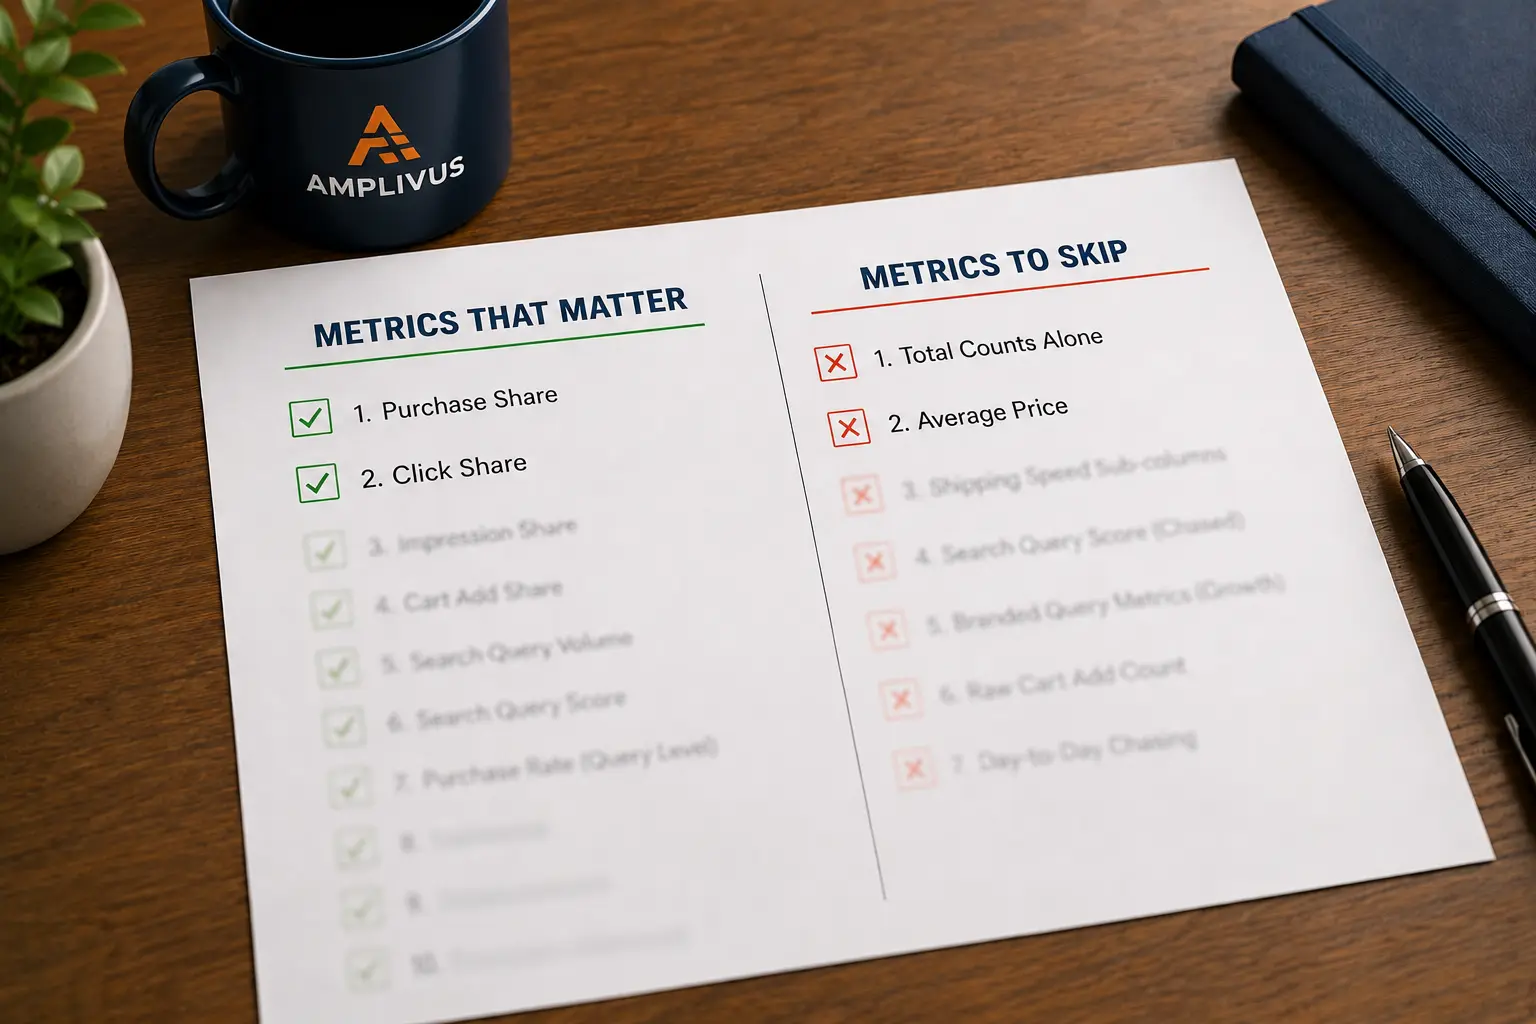
The point of the report is not the raw purchase count. It is the share.
Share tells you whether you are winning or losing the query against everyone else competing for it.
A purchase count can fall while your share rises, which simply means the whole query softened and you held your ground.
Almost every cart-add-to-purchase gap traces back to one of five causes: price, Featured Offer (Buy Box) loss, out of stock, weak social proof, or a detail page that does not close.
Find which one, and you stop guessing.
On Amazon, "add to cart" is not always a buying decision. Many shoppers use the cart as a shortlist, then compare.
The moment they add your item, Amazon surrounds them with carousels of alternatives.
That built-in comparison step is why the platform behaves differently from a standalone store.
Here are the five causes, in the order they usually bite.
Notice that two of the five (Featured Offer and stock) have nothing to do with your listing copy.
That is exactly why "improve your listing" is such weak advice. It treats a structural problem as a creative one.
There is also a sixth, quieter factor worth naming: intent itself. Some queries pull browsers, not buyers.
A broad term like "running shoes" collects shoppers who are still deciding on style, color, and budget, so it will always show a softer cart-to-purchase rate than a precise term like "men's trail running shoes size 11 black."
When you see a low rate on a broad head term, check the query language before you assume something is broken.
The gap may be the natural cost of ranking for a comparison-stage keyword.
Read direction and share, not raw counts, and respect two attribution rules that trip up almost everyone.
The Search Query Performance report is honest, but it is not literal.
First, the cart-add attribution rule. Amazon only counts a cart add against the query when the shopper adds the exact product they clicked.
On a parent listing with several variations, a click on one child and an add of another will not show for that keyword.
Cart-add data is cleanest on single-ASIN listings or parents with two or three children.
Second, the attribution window. SQP attributes a purchase within a short window after the search, roughly same-day.
A shopper who adds today and buys in three days may never appear as a purchase on that query.
This is why your SQP purchases always look lower than your real sales. The fix is to read share and trend, not absolute numbers.
Then there is volume.
A query with eleven clicks and one purchase is not a conversion crisis. It is thin data.
Statistical significance matters, and low-volume queries swing wildly week to week.
Group small queries or widen the date range before you draw any conclusion.
When I audit an account, I sort by cart adds first, then scan for the queries where purchase share falls furthest below cart add share at real volume.
That short list, usually five to fifteen queries, is where the money is.
A small habit that pays off: export the report to a spreadsheet rather than reading it on screen.
Once the data is in a sheet, you can add a column for purchase share divided by cart add share and sort the whole catalog by that single ratio.
The worst offenders rise to the top in seconds, and you stop eyeballing rows. Pull at least four weeks so the trend is real, then compare it to the same period last quarter to separate a true leak from a seasonal swing.
Work the five causes in a fixed order, cheapest and most structural first, so you never cut price to solve a problem price cannot fix.
This is the decision tree.
Stop at the first cause that explains the gap. If you lost the Featured Offer, you are done.
Do not keep tuning images on a listing that is not even serving your buy button.
Run this same tree per query for your top five to fifteen leaking terms. Patterns appear fast.
If the Featured Offer is lost across many queries, you have an account-level pricing or seller-health issue, not fifteen separate problems.
Map the fix to the cause, not to a generic checklist. Each of the five causes has a direct, specific remedy.
After any fix, give the data a clean week, then re-pull the query in SQP and read the trend in purchase share.
One day proves nothing because of the attribution window.
One more practical move: protect a recovered query with a small, defended Sponsored Products bid using a Rule-Based Bidding target so you do not lose the ground you just won.
Sequence the fixes by speed of impact.
A Featured Offer recovery or a price match shows up in purchase share within days. A review build through Amazon Vine takes weeks, and an A+ Content rework needs a fresh run of traffic before the data means anything.
If you change three things at once, you will never know which one worked, so stage them and read the report between each move.
The most common error is cutting price before checking the Featured Offer, which spends margin on a problem price cannot touch.
It happens because price is the one lever a seller fully controls, so it feels like action.
Three more mistakes show up in nearly every account.
A quieter mistake is fixing the listing copy when the carousel is the real opponent. Your rivals appear next to your product the instant a shopper adds to cart.
If they win on reviews or price, no amount of copy polish closes the gap.
The last trap is impatience. Sellers pull the report a day after a change, see no movement, and revert.
Because the attribution window is short and the data settles over several days, a one-day read is almost always misleading.
Give every change a full clean week before you judge it, and never reverse two changes in the same window or you lose the ability to attribute either result.
The fastest signal is comparing your cart add share to your click share, not just to purchase share.
When cart add share holds strong but purchase share collapses, the problem is almost always structural (Featured Offer or stock), because the page clearly sold the shopper well enough to add.
A few habits separate clean diagnosis from guessing.
Pair SQP with Amazon Marketing Stream for near real-time signals when a query drops suddenly, so you catch a Featured Offer loss in hours, not at the next weekly pull.
For deeper path analysis, Amazon Marketing Cloud (AMC) lets you study the longer journey that SQP's short window hides.
Watch Search Catalog Performance alongside Search Query Performance. The catalog view shows demand your listings are not yet capturing, which often explains why a query feels weaker than it should.
Calibrate every benchmark to your own category and price band. A 6 percent purchase rate can be excellent on a considered electronics ASIN and poor on a low-cost consumable. The category is the benchmark.
Treat seasonality as a real variable. A purchase-share dip in a gifting category in January is not a leak, it is the calendar. Compare like periods before you act.
Cross-check SQP against your advertising data too.
When a query shows healthy cart adds in Brand Analytics but your Sponsored Products campaign reports a high cost per order on the same term, the two are telling the same story from different angles: traffic is qualified, conversion is leaking, and ad spend is paying for adds that never close.
Fixing the structural cause usually drops your advertising cost of sale (ACoS) on that term without touching a single bid.
Finally, keep a simple log.
Record the query, the cause you found, the fix, the date, and the share before and after.
Within a quarter you will have a private benchmark library that beats any generic industry average, because it is built from your own catalog, your own price band, and your own buyers.
That log is also the fastest way to onboard a new analyst or hand the account to an agency without losing the context behind every decision.
The cart-add-to-purchase gap is one of the few Amazon problems you can diagnose precisely, because Search Query Performance hands you the funnel query by query.
Read share over counts, respect the attribution window, and walk the five causes in order.
Most sellers do not have a leak across the catalog.
They have five to fifteen queries quietly losing the Featured Offer or the price comparison, and a fixable detail page behind that.
If you want a second set of eyes on those exact queries, Amplivus runs SQP-based conversion audits that isolate the cause and map the fix before a dollar of margin gets spent.
Pull your report, find your top leaking terms, and start with the Featured Offer check today.

Discover whether price, Featured Offer loss, reviews, stock, or your detail page is hurting conversions with a data-led audit.
We identify the exact query, listing, or Featured Offer issue causing drop-offs before margin gets wasted.

.png)
.png)


.png)
.png)