Amazon PPC Strategies for 7-Figure Brands in 2026
Read more
.png)
Amazon PPC cost is ad spend plus fees plus management; ACoS, TACoS, and ad mix shift by spend tier, and your own data beats any published average.
Summarize in ChatGPT
Most articles about Amazon PPC cost give you a single average cost per click or ACoS and stop there, which is close to useless, because those numbers hide more than they reveal.
What you actually pay depends on your category, your price, your margin, and your stage, and a benchmark built for a $20 impulse product tells a premium brand nothing.
Worse, the headline figure ignores two of the three real costs of running PPC: the Amazon fees that set your break-even, and the management cost of running the account well.
This guide breaks down what Amazon PPC actually costs in 2026, gives directional benchmarks by spend tier, and shows you how to read your own numbers, which matter more than any average.
Think of it as a framework rather than a price list. The benchmark ranges here are directional, drawn from how accounts tend to behave at each stage, not fixed rules, and the most important number in the whole piece is the one you pull from your own account.
If your goal is to grow past six figures a month, pair this with our guide on how to scale Amazon PPC past $100K a month.
The first mistake in thinking about PPC cost is counting only the ad spend. There are three costs, and the other two decide whether the first one is even affordable.
The visible cost is what you pay for clicks, and cost per click (CPC) is set by an auction: what competitors bid for the same keyword, how relevant your listing is, and how well it converts.
CPC varies widely by category, from under a dollar in quiet niches to several dollars in crowded, high-value ones, so any single average is only a rough anchor.
The right benchmark is not a published figure but your own, which Amazon's Brand Analytics and Search Query Performance report at the keyword level, showing what shoppers actually pay and where you win.
Run Sponsored Products as the core, and read your real CPC by term rather than trusting a category average.
It is worth being clear about what actually moves your CPC, because a higher click cost is not automatically a problem.
A relevant listing that converts well earns a lower effective cost to win the same placement than a weak one, because Amazon rewards ads that turn into sales.
So two sellers bidding the same amount can pay very different real costs per sale, and the lever is often the listing rather than the bid.
When your CPC feels high, the first question is not whether to bid less but whether the listing and the keyword match is strong enough to justify the click, because fixing conversion lowers your true cost more durably than trimming a bid ever will.
The second cost is the Amazon fees that never appear in your ad report but decide what a click can be worth.
Referral fees and Fulfillment by Amazon fees come out of every sale, so they set your break-even ACoS, your margin before advertising. A heavy or oversize product with high fulfillment fees can absorb far less ad cost than a light, high-margin one at the same price.
That is why two sellers with identical CPCs can have completely different healthy ACoS targets, and why any cost benchmark that ignores your fee structure is guessing.
Calculate break-even per product before you judge whether a CPC is affordable.
This is also why fee changes should trigger a bid review. When Amazon adjusts its fee schedule, or when your landed cost moves because of freight or materials, your break-even shifts even though nothing in your campaign changed, and a bid that was profitable last quarter can quietly go underwater.
Sellers who set their bids once and forget them are the ones most exposed to this, because the number that made a click affordable is no longer the number in effect.
Treat any change to fees or costs as a prompt to recompute break-even per product, so your bids always reflect the margin you actually have rather than the one you had when you set them.
The third cost is running the account: the hours of in-house time or the agency fee it takes to structure campaigns, harvest keywords, manage bids, and read the data.
It is easy to ignore because it does not show in the ad console, but a poorly managed account wastes far more in inefficient spend than good management costs.
Whether you keep it in-house or outsource, count management as part of the true cost of PPC, and weigh it against the waste it prevents.
Our Amazon PPC management pricing page lays out how that cost typically works.
The way to think about management cost is against the spend it governs. A few hours a week of skilled attention on a $30,000-a-month account is cheap if it trims even ten percent of wasted spend, and expensive only if the account is small enough that the waste it prevents is trivial.
That is why management economics change by tier: a launch brand spending a few thousand dollars may reasonably run the account itself, while a scaling brand spending tens of thousands almost always comes out ahead paying for expertise, because the waste in an unmanaged account at that size dwarfs the fee.
The mistake is treating management as an optional extra rather than as the part of the cost structure that decides how efficient the other two parts are.
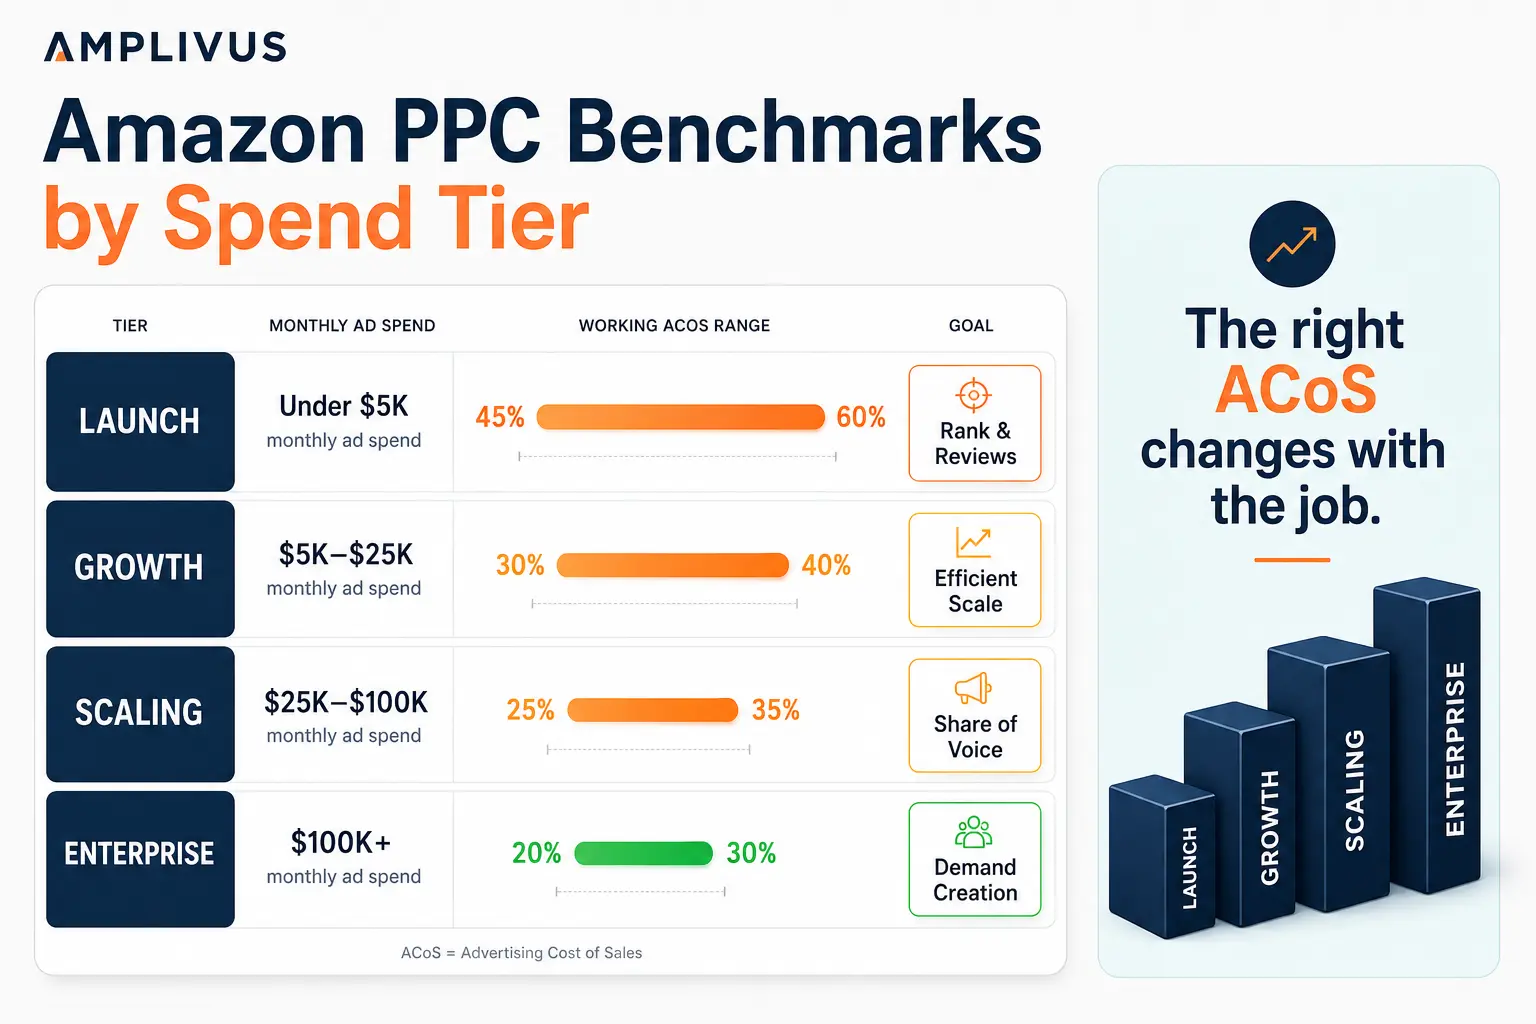
Cost benchmarks only make sense in the context of your stage, because the right ACoS at launch is the wrong ACoS at scale. Treat these as directional ranges to adjust against your own margin and category.
The pattern is consistent across categories: you spend inefficiently on purpose at launch to buy rank and reviews, then tighten as organic sales grow and carry more of the load.
A rising ACoS at launch is not a problem; it is the cost of buying a position. A rising ACoS at scale, with flat sales, is a warning.
The metric that tells the difference is TACoS, total ad spend against total revenue, which shows whether paid spend is lifting the whole business or just churning.
Ad mix shifts by tier too, from almost all Sponsored Products early to a fuller blend at scale.
Percentage of revenue spent on ads follows the same logic: new brands often run 20 to 40 percent of revenue while buying traction, scaling brands 15 to 25 percent, and mature brands with strong organic rank 8 to 15 percent.
The advanced moves that define the top tier are covered in our guide on PPC strategy for 7-figure brands.
A cost breakdown for 2026 has to account for direction, and the direction is up. Understanding why keeps you from blaming your account for a market-wide shift.
Amazon advertising has grown into one of the largest ad businesses in the world, and as more sellers compete for the same placements, cost per click rises over time.
That means an ACoS that held steady last year can drift up this year with no change to your account, purely from a hotter auction.
The response is not to panic-cut but to lower your reliance on paid clicks: build organic rank, which Amazon's guidance on search rankings ties to sales velocity and conversion, so a larger share of sales come free, tighten targeting so you stop paying for clicks that do not convert, and let efficiency come from structure rather than from bidding wars you cannot win.
Reading the price and competition trends in your own data, covered in our guide on reading click price trends in your SQP report, is how you tell a market shift from an account problem.
The cost picture is also widening because there are more places to spend.
Amazon DSP, self-serve Sponsored TV, and audience tools give larger brands ways to spend beyond search, which shifts the enterprise cost mix toward demand creation.
These are not cheaper clicks; they are different jobs, judged on new-to-brand and lifetime value rather than a search ACoS, so factor them into your cost planning as investments in growth rather than efficiency plays.
A brand that judges an upper-funnel channel by the same ACoS it uses for bottom-funnel search will always conclude the new surface is too expensive and cut it, when in fact it is doing a job the search metric was never built to measure.
The most useful thing in any cost article is the reminder that the average is not your target. Two accounts in the same category can have very different healthy numbers.
A published average blends premium and budget products, oversize and light ones, mature and launching listings, and lands on a figure that fits none of them exactly.
Anchoring to it can push you to cut a launch that should run hot or to accept waste on a mature product that should run lean. Use averages to sanity-check your own numbers, not to set them, and always adjust for your price, margin, and stage.
The foundational mechanics of how the ad types and costs fit together are laid out in our guide on Amazon Sponsored Ads explained.
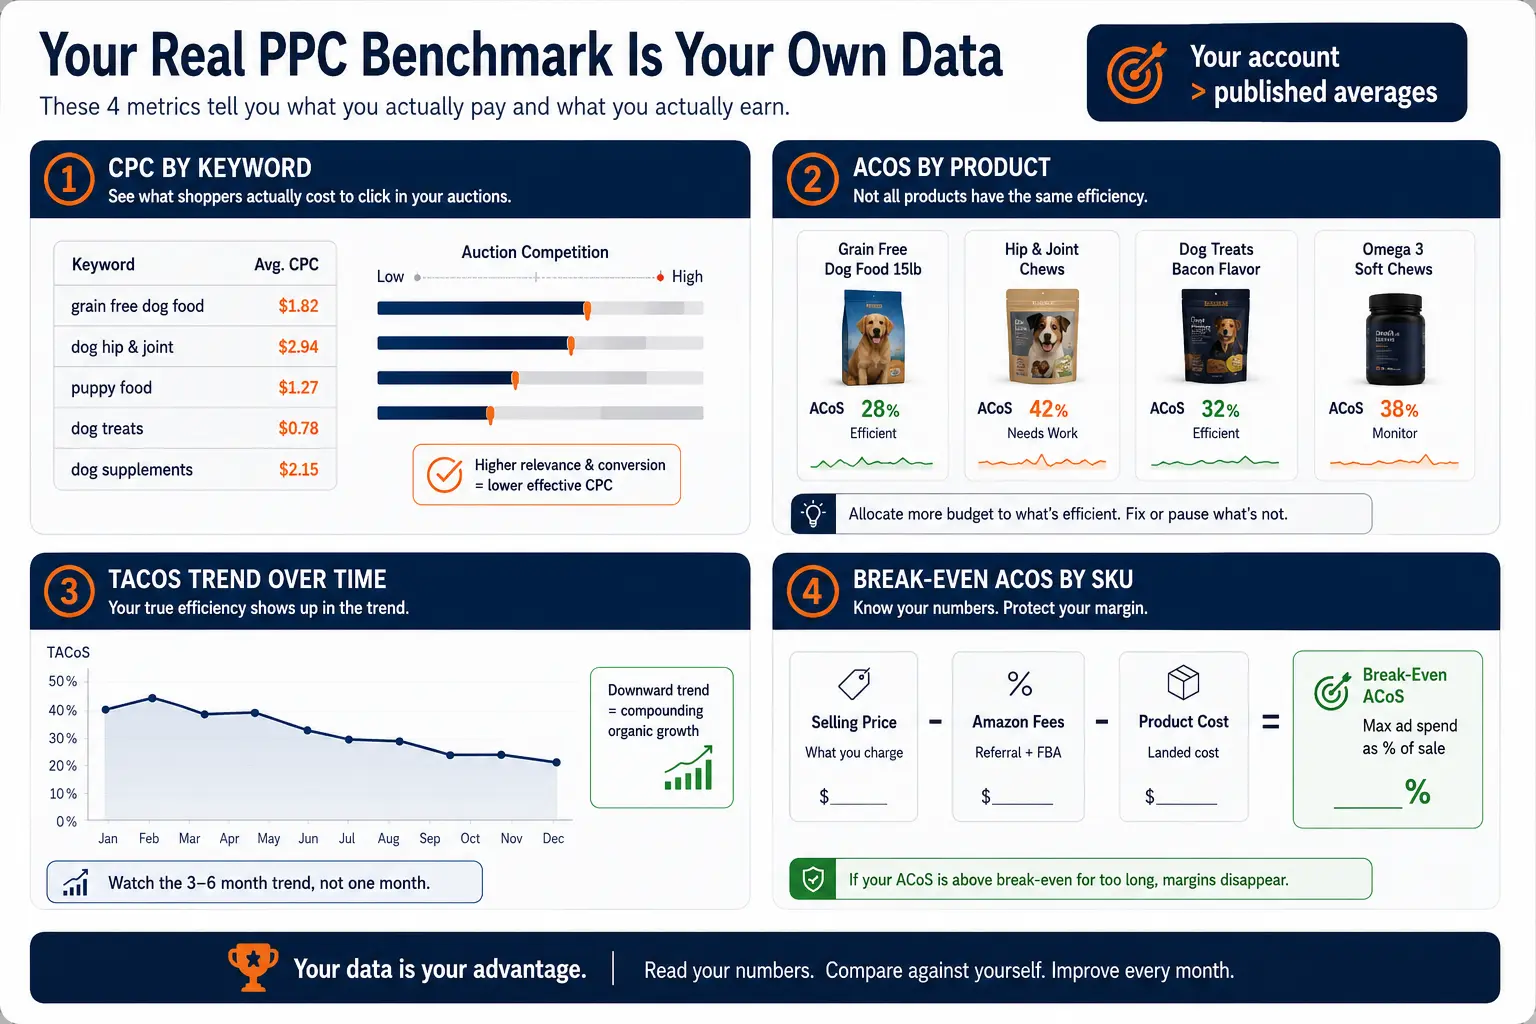
Your real benchmarks come from your account: your CPC by keyword, your ACoS by product, your TACoS trend over time, and your break-even per SKU. Those four numbers, tracked across months, tell you more than any category report, because they reflect your actual economics.
Amazon's reporting gives you the raw data, and the discipline is to read it regularly and act on the trend rather than the snapshot, which is exactly the ongoing work a structured Amazon PPC management practice is built to hold.
The trend matters more than any single reading. One month's ACoS can jump for reasons that have nothing to do with your account, a seasonal swing, a competitor's promotion, a temporary auction spike, so a snapshot invites overreaction.
What you want is the direction over time: is your TACoS falling as organic rank builds, is your break-even holding as fees change, is your CPC drifting up across a whole set of keywords in a way that signals a market shift rather than a targeting mistake.
Reading the trend keeps you from cutting a campaign that had one bad week or scaling one that had a lucky one, and it is the single habit that separates operators who control their PPC cost from those who react to it.
A benchmark article gives you the ranges.
What it cannot see is where your specific account sits against its own economics: a launch running too lean to rank, a mature product bleeding on branded terms, or a fee structure that quietly makes your headline ACoS unprofitable.
Those are findable, and they usually free money rather than needing more.
That is a specialist's job, and a cost review usually pays for itself in the waste it uncovers.
As a specialist Amazon PPC agency, Amplivus reads cost the way it actually works, ad spend, fees, and management together, not the headline number alone.
A free Amazon PPC audit shows where your real cost is higher than it should be, and a short Amazon strategy session maps the fixes worth making first.

Stop judging performance by generic averages. Get a clear account-level review of your CPC, ACoS, TACoS, break-even, and wasted spend.
Book a strategy call to review your spend, margins, and growth goals, then map the PPC moves worth prioritizing next.

.png)
.png)


.png)
.png)