Amazon PPC for Kitchen Brands: 2026 Strategy by Spend Tier
Read more
.png)
Kitchen gadget PPC costs differ from appliances: lighter fees, impulse conversion, and viral swings make averages mislead, so benchmark from your own data.
Summarize in ChatGPT

Most cost benchmarks for kitchen brands quietly assume you sell appliances: heavy, oversize, high-ticket products with thick fulfillment fees and slow, considered purchases.
A kitchen gadget is almost the opposite. It is light, often standard-size, mid-ticket, bought on impulse, and swept up in trends that spike demand overnight.
Benchmarking a gadget account against appliance averages, or against a generic figure that blends the two, will steer you wrong in both directions at once, telling you to accept costs that are too high on one product or to cut spend that is actually working on another.
This guide is about benchmarking Amazon PPC cost for kitchen gadgets specifically in 2026: why the usual numbers mislead, what the gadget cost profile actually looks like, and how to build a benchmark you can trust.
Think of it as a companion to the method rather than a fixed price list.
The general framework for the three real costs of PPC is laid out in our guide on the Amazon PPC cost breakdown by spend tier; this piece adapts that method to the specific economics of a gadget, where the fee profile and the buyer behave nothing like the heavy end of the kitchen aisle.
The first rule of benchmarking is to compare against the right reference, and for a gadget the appliance reference is the wrong one.
The single biggest cost difference is fulfillment. Heavy and oversize kitchen appliances carry the tier's worst fees, and 2026 changes made those tiers more expensive, but most gadgets sit in standard-size tiers where the fee load is far lighter.
That matters for benchmarking because your break-even Advertising Cost of Sale, your margin before ads, is set by those fees, and a gadget with light fulfillment costs can often afford a healthier cost of sale than an appliance at the same price.
Check your exact rates in the current Fulfillment by Amazon fee schedule, because the point is not the specific number but the direction: a benchmark built on oversize-appliance economics assumes a fee burden a gadget usually does not carry, so it will tell your gadget to run leaner than it needs to.
An appliance is a considered purchase; a shopper compares, reads the page twice, and takes days. A gadget is often an impulse buy, cheaper and lower-risk, so it converts faster and on shorter consideration.
Higher conversion changes your cost math, because the same cost per click turns into more sales, which supports a healthier ACoS than a slow-converting appliance benchmark would suggest.
Benchmarking your gadget's cost against a considered-purchase average understates what your faster conversion can support, and can push you to underspend on demand you could profitably capture.
The two differences compound rather than cancel. A gadget with both lighter fees and faster conversion has meaningfully more room to spend on a click than an appliance benchmark implies, which is why gadget sellers who borrow appliance targets so often feel they are leaving growth on the table without knowing why.
The reverse trap exists too: a gadget priced very low can have such thin absolute margin per sale that even a modest ACoS eats all of it, so the lighter fee profile does not automatically mean you can spend freely.
The point of benchmarking correctly is to know which of these is true for your specific product, rather than inheriting an assumption baked into a number built for a different kind of item.
With the wrong references cleared away, here is what actually drives a gadget's PPC cost, so you know what to measure against.
Gadgets live in one of the most crowded corners of Amazon, where low barriers to entry mean many sellers competing for the same terms, so cost per click can run higher than a niche category despite the lower price point.
That competition is also volatile: when a gadget trends, new advertisers pile in and cost per click climbs, then eases as the wave passes.
The right benchmark for your cost per click is therefore your own, read at the keyword level in Amazon's Brand Analytics and Search Query Performance, not a static category figure that cannot know how hot your specific terms are this month.
Run Sponsored Products as the core and read your real cost by term rather than trusting an average.
Cost benchmarks only make sense in the context of a product's stage. Treat these as directional ranges to adjust against your own margin and fee tier, not fixed rules.
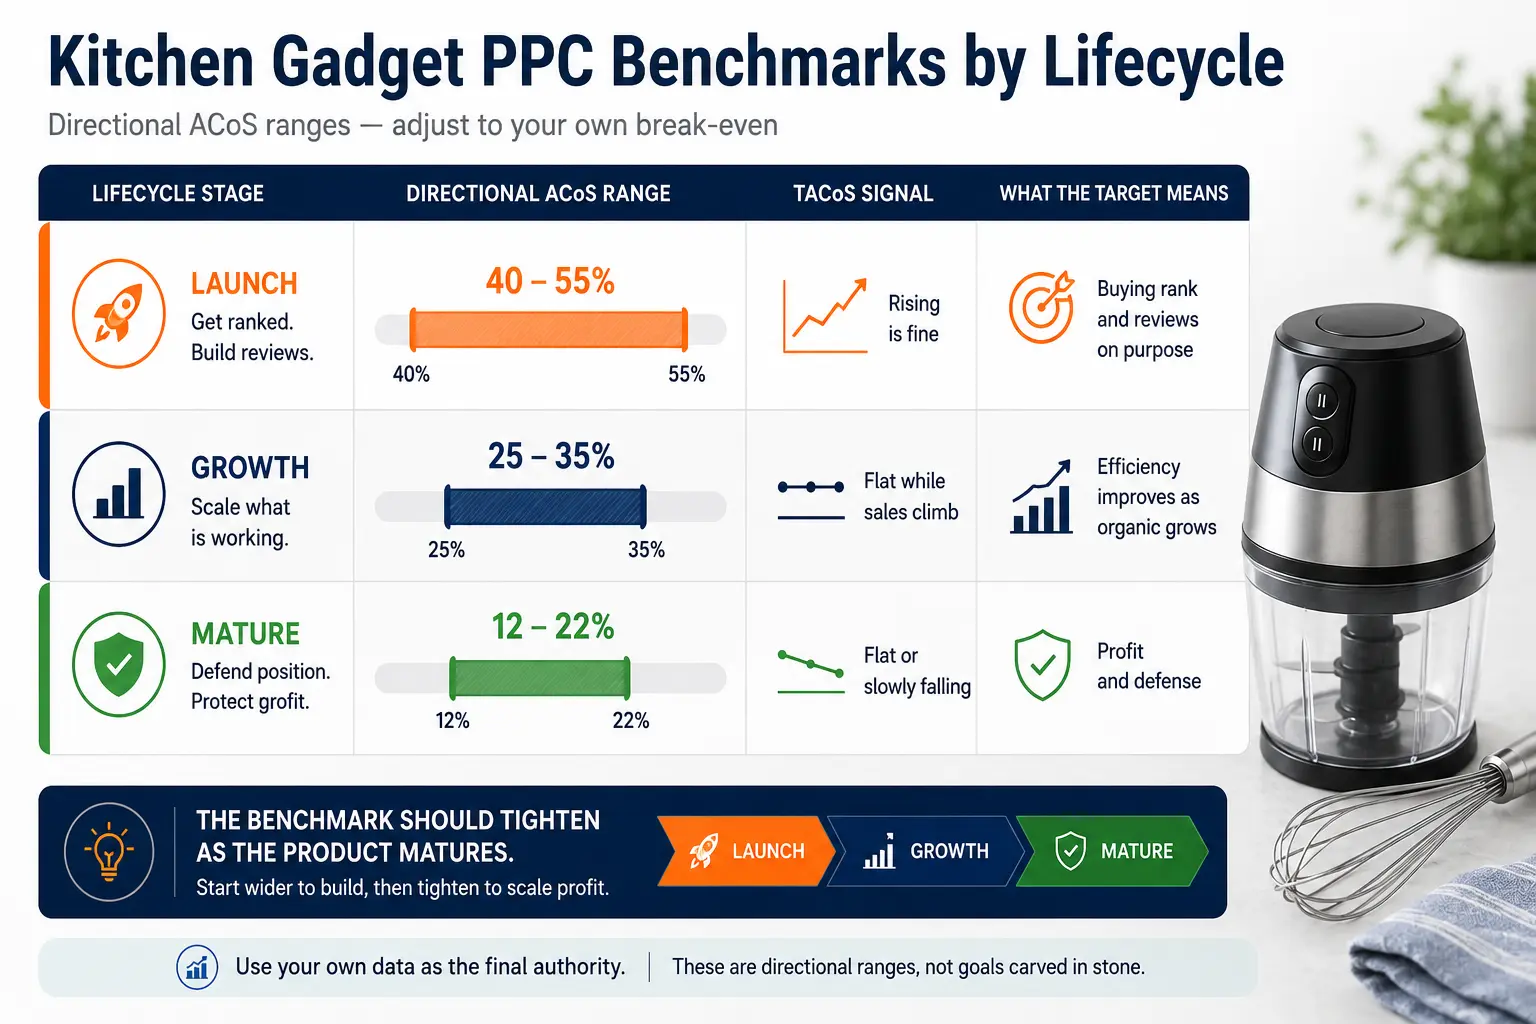
These ranges tend to sit a little tighter than a heavy-appliance benchmark at maturity, because a gadget's lower price leaves less absolute margin per sale, and a little looser than you might expect at launch, because faster impulse conversion buys rank more efficiently.
Anchor them to your own break-even rather than copying them, and read Total Advertising Cost of Sale, which is ad spend against total revenue, to confirm paid spend is lifting organic rank rather than just renting sales.
It is worth stressing why the launch range runs hot on purpose. A new gadget has no rank and no reviews, so early spend is buying a position rather than turning a profit, and a launch ACoS that would alarm you on a mature product is simply the price of entry in a crowded category.
The mistake is holding a mature-stage benchmark against a launching product and cutting the spend that would have bought the rank, which strands the launch in the middle of the results where nobody finds it.
Benchmarking by stage, not by one account-wide number, is what keeps you from starving a launch or tolerating waste on a hero, and for a gadget with a fast lifecycle those stages arrive quickly, so the benchmark has to move with the product.
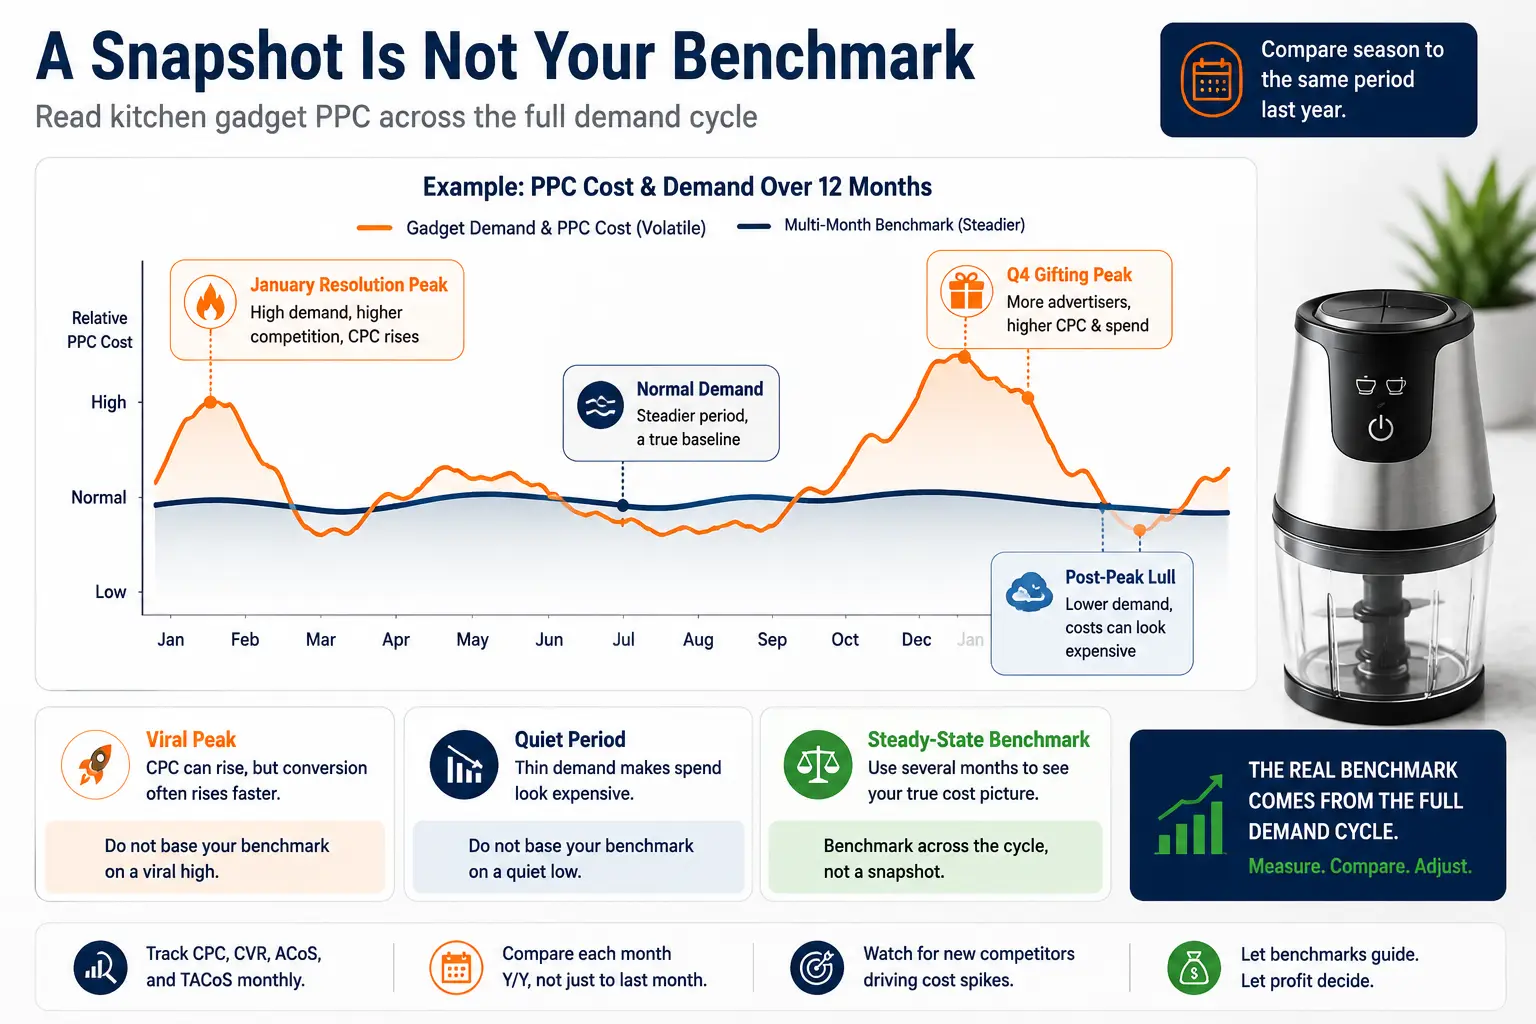
The defining feature of gadget benchmarking is volatility, and it breaks any static number you try to hold.
When a gadget trends, volume spikes, cost per click jumps, and conversion often rises with the surge of intent, so any single month's cost figures can look nothing like your steady-state numbers.
Benchmark against one hot week and you will set targets you cannot hold once the wave breaks; benchmark against a dead stretch and you will underspend when demand returns.
The only reliable read is across the cycle: pull several months that include both peaks and quiet periods, and let the trend, not the snapshot, define your normal.
The auction mechanics behind those viral swings, and how to bid through them, are covered in our guide on bidding for viral kitchen products.
There is a subtler distortion to watch for as well. During a trend, a gadget's cost per click can rise while its ACoS actually falls, because the surge of high-intent demand lifts conversion faster than competition lifts the click price.
That can make a viral period look deceptively efficient, tempting you to set a permanent benchmark you will never hit once the wave passes and conversion normalizes.
The opposite happens in the trough, where thin demand makes even careful spend look expensive.
Neither extreme is your real cost, and a benchmark anchored to either will have you chasing a number that only existed for a moment. The steady-state figure you actually manage against lives in the average across the whole cycle, not at its edges.
Kitchen gadgets carry two demand peaks, Q4 gifting and the January cooking-resolution surge, and cost per click climbs in both as competition heats up.
That means your healthy ACoS in November is not your healthy ACoS in March, and a benchmark that ignores season will flag a normal seasonal rise as an account problem.
Read your cost against the same period last year, not the month before, so you are comparing like with like and not mistaking a predictable seasonal climb for a leak that needs fixing.
Reading those price and competition shifts in your own data is covered in our guide on reading click price trends in your SQP report.
The most useful benchmark for a gadget is not published anywhere; it is the one you build from your account.
Your real benchmark comes from four numbers tracked over months: your cost per click by keyword, your ACoS by product, your TACoS trend, and your break-even per SKU with current fees counted.
Those reflect your actual economics, your actual fee tier, and your actual auction, which no category average can. The discipline is to record these on a regular cadence and watch the direction, not just the latest reading, because a single month tells you almost nothing in a category this volatile.
A benchmark you build and update yourself becomes more accurate every month you keep it, while a borrowed figure was never accurate for your product to begin with and does not improve with age.
Use a published figure only to sanity-check, never to set your targets, and always adjust it for your price, your specific fee profile, and where the product currently sits in its trend cycle.
The foundation that ties your ad types and costs together is laid out in our guide on Amazon PPC for kitchen brands by spend tier.
The best way to improve your cost benchmark over time is to need fewer paid clicks per sale, which means building organic rank so a larger share of sales come free.
Amazon's own guidance on search rankings ties rank to sales velocity and conversion, both of which a gadget's impulse buyer supplies well, so paid spend that builds rank during a hot trend can leave you with cheaper organic sales long after the wave has passed.
A benchmark that only measures paid cost misses this; the goal is a falling reliance on paid, not just a lower cost per click, and that is what a disciplined Amazon PPC management practice builds toward.
As a gadget account scales, the cost picture also widens beyond search.
Once your search campaigns are efficient and you have a base of customers, Amazon DSP and other surfaces give you ways to spend that are judged on new-to-brand and lifetime value rather than a search ACoS, so factor them into your cost planning as growth investments, not efficiency plays that should hit the same benchmark.
A single blended cost number across search and demand-creation spend hides both, which is one more reason a gadget benchmark has to be read by role and stage rather than as one figure for the whole account.
Benchmarking a gadget account well takes patient, structured reading: pulling months of data across the trend cycle, separating seasonal rises from real leaks, and comparing your cost to your own economics rather than a borrowed average.
Done well, it tells you exactly where your cost is genuinely too high and where it only looks that way against the wrong benchmark.
That is a specific, findable set of answers. As a specialist Amazon PPC agency, Amplivus benchmarks kitchen and gadget accounts against their own economics, not a generic figure, and a structured Amazon PPC competitor analysis shows where your real competitive cost sits.
A free Amazon PPC audit checks whether your cost is higher than it should be, and a short Amazon strategy session maps the fixes worth making first.

Stop relying on appliance averages. Build a kitchen gadget PPC benchmark around your fees, lifecycle, seasonality, and real account data.
Book a strategy call to benchmark your gadget PPC by lifecycle, season, fee load, and your real break-even economics.
.png)
.png)


.png)
.png)