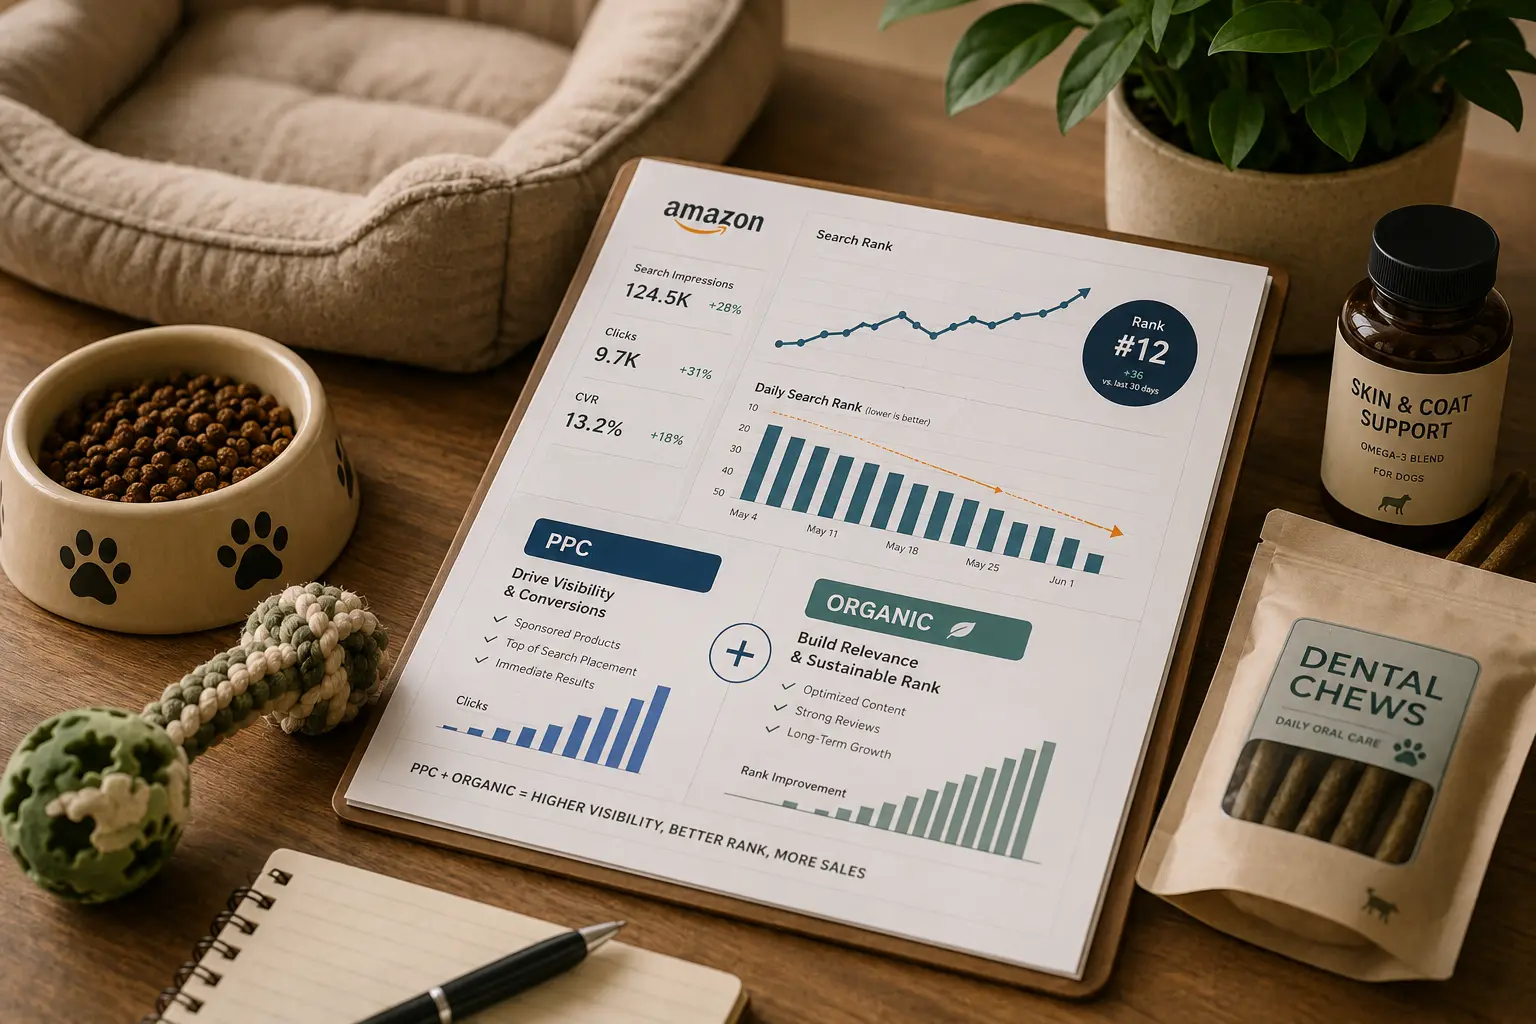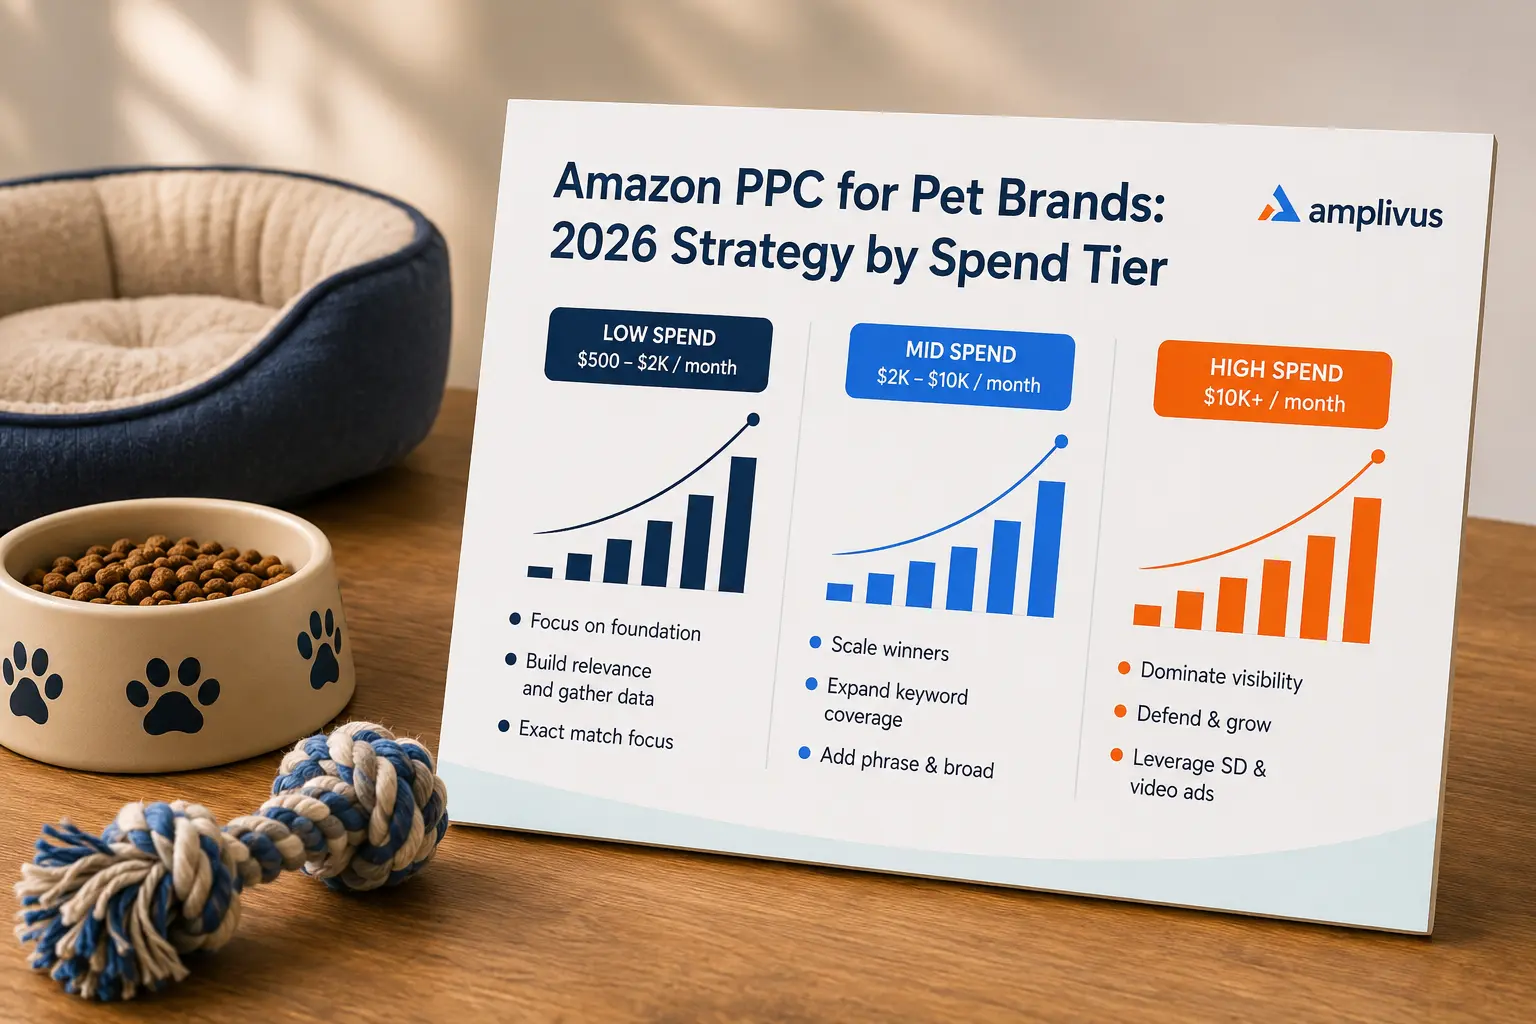
Amazon PPC for Pet Brands: 2026 Strategy by Spend Tier
Read more
.png)
Pet PPC cost cannot be benchmarked on first-order ACoS: reorders make a customer worth far more than one sale, so benchmark against lifetime value by segment.
Summarize in ChatGPT

Most Amazon PPC cost benchmarks quietly assume a one-and-done purchase: you spend to acquire a sale, and the ACoS on that sale tells you whether it was worth it. For a pet brand, that assumption is wrong in a way that costs real money, because a pet customer rarely buys once.
They reorder food, treats, and supplements for months or years, and many subscribe. That means the true cost of acquiring them should be measured against a stream of purchases, not a single one, and a benchmark built on first-order ACoS will tell a healthy pet account it is failing.
This guide is about benchmarking Amazon PPC cost for pet brands specifically in 2026: why the standard numbers mislead, how to benchmark against lifetime value, and why you have to segment the benchmark by product to get it right.
Treat it as a companion to the method rather than a fixed price list.
The general framework for the three real costs of PPC is laid out in our guide on the Amazon PPC cost breakdown by spend tier; this piece adapts that method to a repeat-purchase category where the first sale is the least important part of the picture.
The first rule of benchmarking is to compare against the right reference, and for pet the standard first-order reference is the wrong one.
A pet owner who buys your food, treats, or supplement and likes it reorders, often for the life of the pet, and Subscribe & Save turns that into an automatic stream of purchases at no further ad cost.
So the real return on acquiring that customer is not the margin on one sale, it is the margin on all the sales that follow. Benchmark your acquisition cost against the first order alone and you will judge a profitable customer as a loss, because the single-sale ACoS shows only the down payment, not the full value.
The US pet industry sits around $158 billion in 2025 and is projected near $165 billion in 2026, and much of that runs on exactly this repeat behavior, which is why a first-order benchmark systematically understates what a pet brand can afford to spend.
The number to benchmark against is what an average customer is worth over their relationship with you, not what they spend on the first order. Calculate the margin a typical buyer produces across a year of reorders, and your affordable acquisition cost is a fraction of that, not a fraction of one sale.
That reframes a first-order ACoS that looks alarming into a sound investment, and it is why lifetime-value bidders can spend more to acquire the same customer than single-sale bidders and still come out ahead.
Any pet benchmark that stops at the first order is measuring the wrong thing.
A worked example makes the gap concrete. Suppose a bag of dog food sells for $45 and leaves $9 in margin after cost, fees, and freight, so the first-order break-even is a 20 percent ACoS, and a 35 percent acquisition ACoS looks like a clear loss.
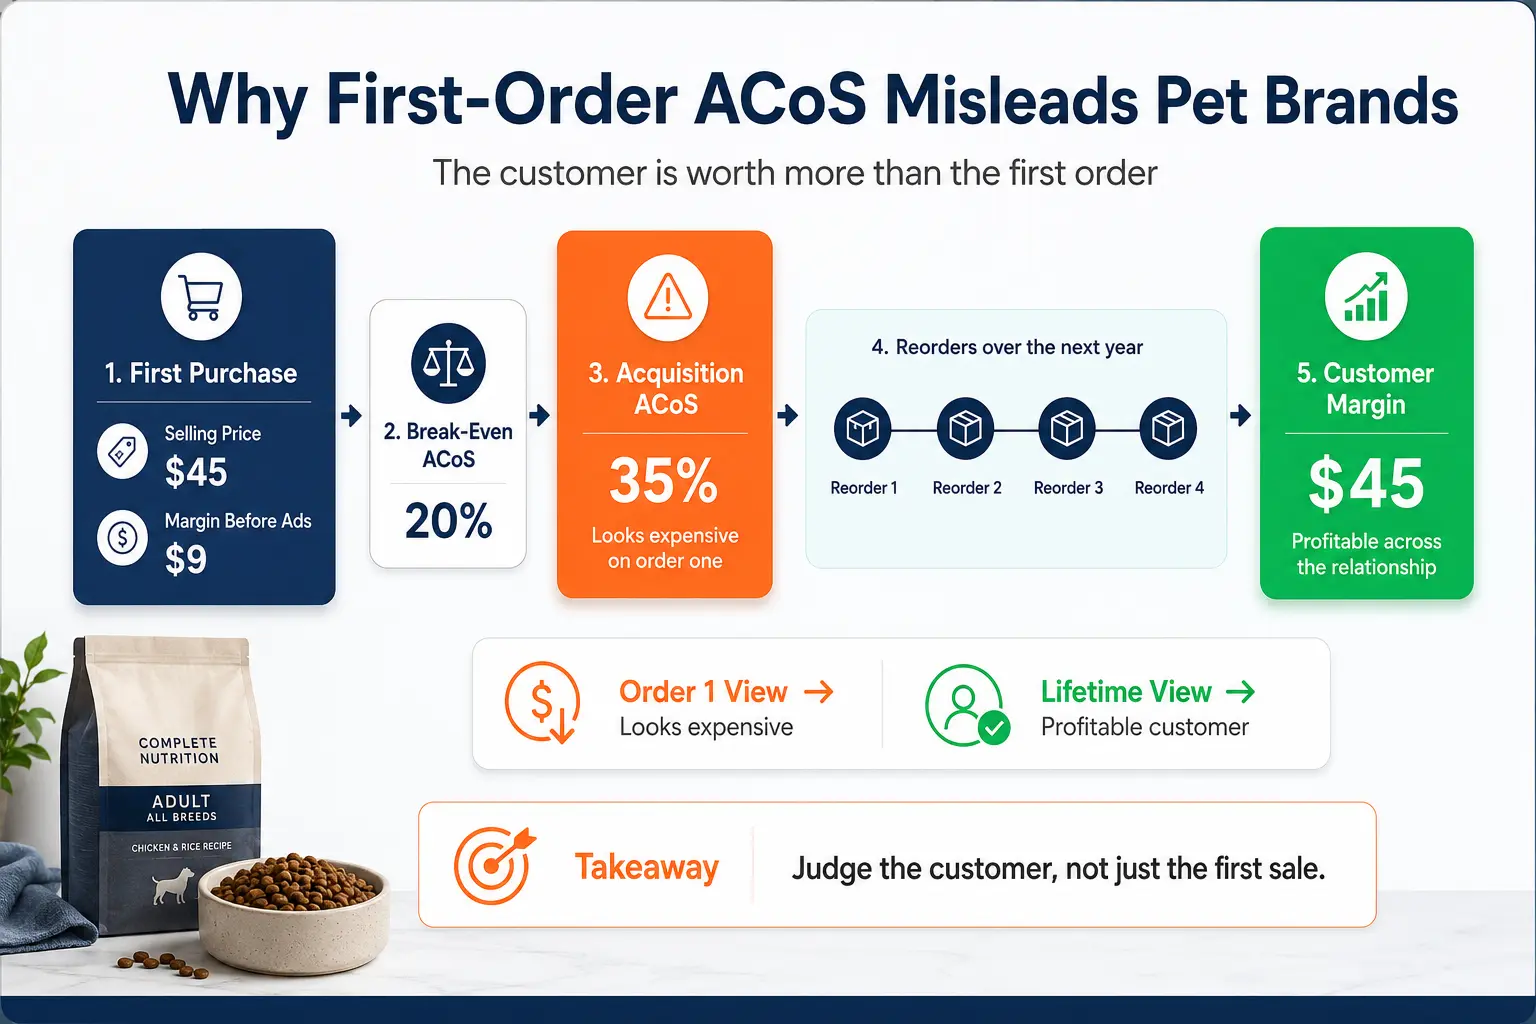
But if the average buyer reorders four times over the next year, that one acquisition is worth $45 in margin, not $9, and the same 35 percent first-order ACoS is comfortably profitable across the relationship.
Judged on the first sale you would cut the campaign; judged on the customer you would fund it harder.
The economics that make this repeatable across a pet catalog are laid out in our guide on how pet brands scale past $100K a month, and they are the reason a first-order benchmark is not just imperfect here but actively misleading.
Pet is not one market, and a single blended cost benchmark across it is meaningless, because the segments carry completely different economics.
Heavy food and litter sit in oversize and heavy tiers where Fulfillment by Amazon fees take a large bite, so their break-even cost of sale, the margin before ads, is thin, and their benchmark has to reflect that.
Treats and chews sit in the middle with lighter weight and better margins. Supplements are light and high-margin, so they can afford a healthier cost of sale than a heavy bag of food at the same price.
Benchmarking a supplement against a food average, or the reverse, will steer you badly wrong, so the benchmark has to be set per segment against each product's real fee load and margin, not for the account as a whole.
The gap is not small either: a light supplement and a heavy bag of food at the same shelf price can have break-even ACoS targets ten or more points apart purely because of the fulfillment fee difference, so a blended benchmark that sits between them is simultaneously too loose for the food and too tight for the supplement.
The segments also reorder at different rates, which changes their lifetime value and therefore their affordable cost. Food and consumables reorder most, so they justify the loosest acquisition cost despite their thin per-order margins, because the steady stream of reorders more than repays it over time.
Durable goods like beds and bowls reorder rarely, so their benchmark has to stand on the first sale and a little cross-sell, not a subscription stream.
Setting one cost target across products that reorder monthly and products bought once every few years wastes spend on some and starves others.
The practical move is to hold two numbers for every pet product: a break-even that says what the first sale can bear, and a lifetime value that says how far past break-even the reorders let you push.
A monthly-reorder consumable can run far past its first-order break-even because the stream repays it; a one-time durable good cannot, so its cost has to clear on the sale itself.
Brands that use a single account-wide target inevitably get both wrong, bidding too timidly on their most repeatable products and too freely on the ones that never come back.
The segment benchmark is really just a shorthand for that per-product pairing of break-even and lifetime value.
Subscribe & Save is the single biggest reason pet cost benchmarking differs from other categories, and it should be built into the benchmark directly.
Two pet products can post the same first-order ACoS while one quietly builds a base of subscribers and the other sells once and stops, and only the subscription attach rate reveals the difference.
A product with high attach can carry a much looser acquisition cost, because each new customer becomes a recurring one; a product with low attach has to earn its return on the first sale.
So the benchmark for a pet product is not one number but a function of its attach rate, and tracking attach by product, not just ACoS by campaign, is what tells you which spend compounds into an annuity.
Run Sponsored Products as the base and read attach alongside cost, because the two together define what healthy actually means here.
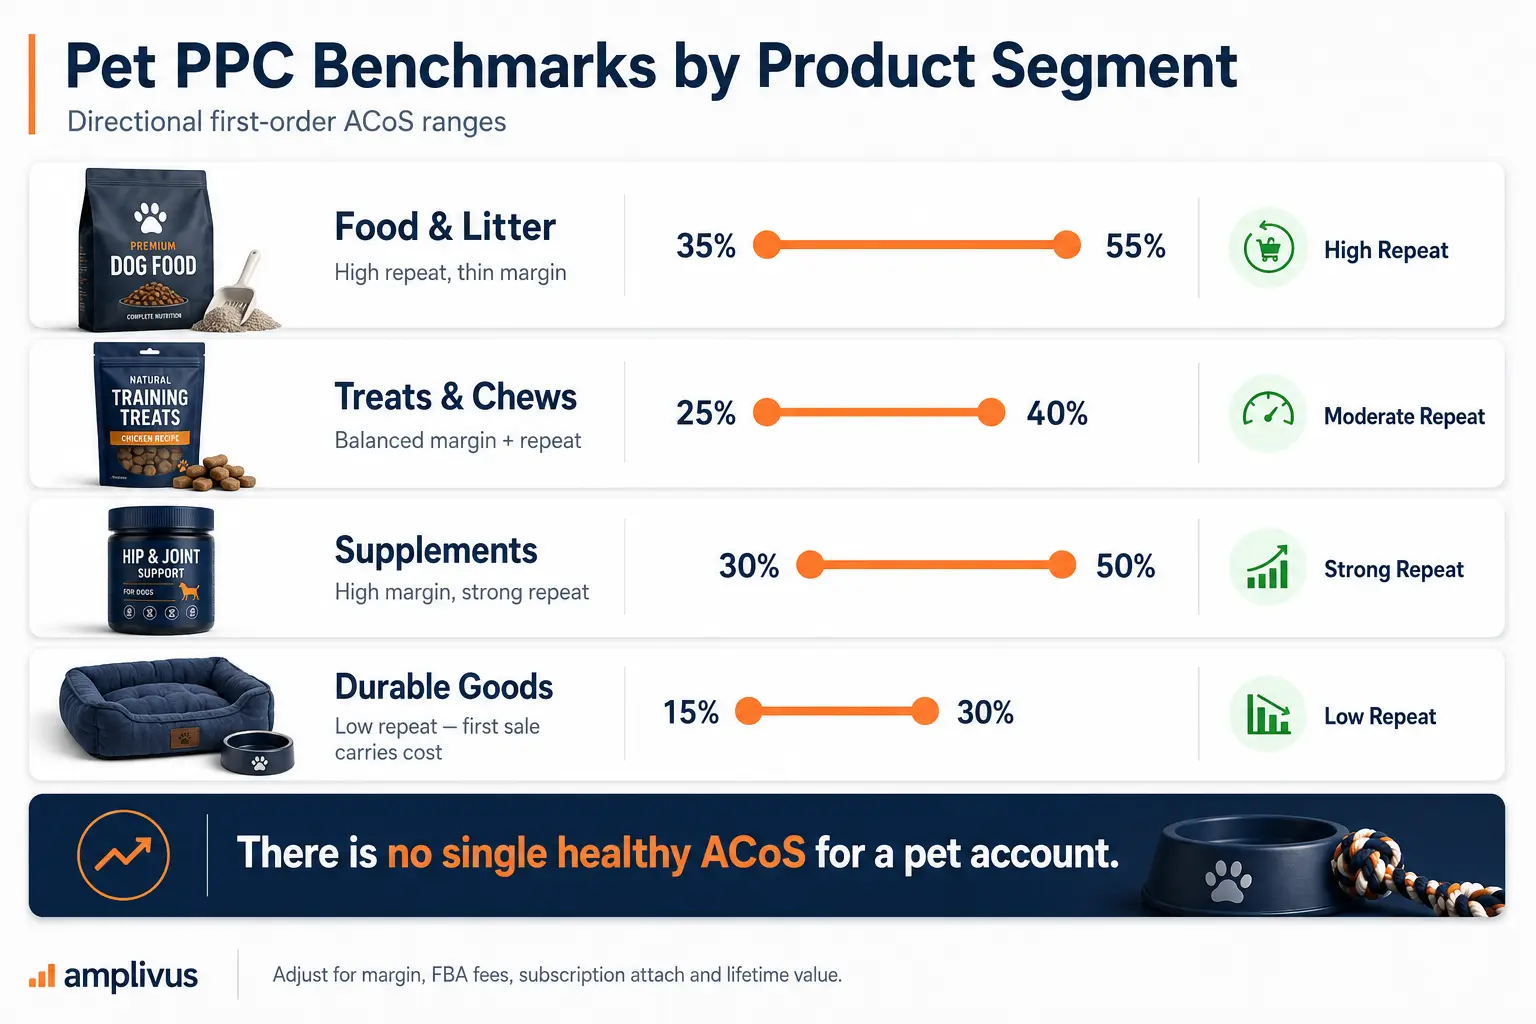
Cost benchmarks only make sense in context. Treat these as directional starting points to adjust against your own margin, fee tier, and repeat rate, not fixed rules.
These first-order ranges look looser than a one-off category would tolerate precisely because reorders repay them; read them alongside Total Advertising Cost of Sale, ad spend against total revenue, which shows whether your paid spend is building the repeat base rather than just renting single sales.
The tier framework that these segment benchmarks fit inside is laid out in our guide on Amazon PPC for pet brands by spend tier, which frames how the targets shift as an account grows.
The ranges also move with your own repeat rate, so treat the table as a starting point you calibrate, not a target you copy.
A food brand with an unusually high reorder rate can run the top of the food range and still profit, while one whose customers rarely come back should sit well below it, even though both sell food.
The published range cannot know your reorder behavior; only your own data can, which is why the segment column is a prompt to check your numbers rather than a number to adopt.
The moment you fold your actual repeat rate into the benchmark, it stops being a borrowed average and becomes a real target for your specific business.
The most useful pet benchmark is not published anywhere; it is the one you build from your account and your reorder behavior.
Your real benchmark comes from a handful of numbers tracked over months: your cost per click by keyword and your ACoS by product, which Amazon's Brand Analytics and Search Query Performance report, plus your break-even per SKU with current fees, your subscription attach rate by product, and your customer lifetime value.
Those last two are what make a pet benchmark accurate, and they are exactly what a category average cannot know.
Use a published figure only to sanity-check, never to set your targets, and always adjust it for your segment, your specific fee load, and your actual repeat rate before you act on it.
The best way to improve your cost benchmark over time is to need fewer paid clicks per sale, which in a repeat category is especially powerful because reorders and subscriptions arrive organically once you have won the customer.
Amazon's guidance on search rankings ties rank to sales velocity and conversion, and a base of subscribers keeps that velocity strong without further ad spend, so a pet brand that builds rank and retention lowers its blended cost of sale over time.
Measuring only paid cost misses this, which is why the goal is a falling reliance on paid, not just a lower cost per click.This is where the pet advantage compounds.
A subscriber does not just reorder at zero ad cost; those reorders feed the sales velocity that holds organic rank, which brings in more free sales, which lowers your blended cost further.
A brand that reads its benchmark as paid cost alone never sees this virtuous cycle and cuts the very spend that starts it.
Maintaining that discipline is what a steady Amazon PPC management practice is built to hold, and the full mechanism behind the paid-to-organic lift is covered in our guide on how pet brands combine PPC and organic to win search rank.
Benchmarking a pet account well takes patient, structured reading: pulling cost and reorder data together, setting a lifetime-value-adjusted target per segment, and separating a product that looks expensive on the first sale from one that genuinely is.
Done well, it usually frees budget on products you were over-restraining and flags the ones truly running too hot.
That is a specific, findable set of answers.
As a specialist Amazon PPC agency, Amplivus benchmarks pet accounts against lifetime value and segment economics, not a generic figure, and a structured Amazon PPC competitor analysis shows where your real competitive cost sits.
A free Amazon PPC audit checks whether your cost is higher than it should be, and a short Amazon strategy session maps the fixes worth making first.

Stop judging pet PPC on the first sale. Build targets around repeat purchases, subscription value, fees, and the real lifetime value of each customer.
Find where first-order ACoS, weak segment targets, and missed repeat value are distorting the true cost of acquiring pet customers.