.png)

Secrets of ROAS and ACoS for Smarter Advertising
Struggling to figure out if your ad spend is driving profits or draining your budget? You’re not alone. For advertisers, understanding which metrics matter most can feel like navigating a labyrinth. Should you optimize for ROAS or ACoS? And where does TACoS fit into the equation?
This guide unpacks these essential advertising metrics, helping you confidently track, measure, and refine your ad campaigns for maximum effectiveness. By the time you're done reading, you'll have a clear understanding of what ROAS, ACoS, and TACoS are, how they’re calculated, and when to use each one.
What is ROAS?
ROAS (Return on Ad Spend) measures the efficiency of your advertising campaigns by telling you how much revenue you make for every dollar spent on ads.
Formula
ROAS = Conversion Value ÷ Ad Spend
For example, if you spent $500 on ads and generated $2,500 in sales, your ROAS would be $2,500 ÷ $500 = 5 (or 5X).
Why ROAS is Important ?
- Shows campaign profitability
- Helps allocate budgets to high-performing ads
- Essential for revenue-driven platforms like Google Ads
If your ROAS is above the break-even point (the point where ad spend equals profit margins), you’re generating a profit. A ROAS of 4X or higher is generally considered excellent, but this benchmark depends on your industry and business model.
What is ACoS?
ACoS (Advertising Cost of Sale) flips the concept of ROAS on its head. Instead of asking, "How much did I earn for every dollar spent?" ACoS asks, "What percentage of my revenue was spent on ads?"
Formula
ACoS = (Ad Spend ÷ Ad Revenue) × 100
For example, if you spent $50 on ads and earned $200 in sales, your ACoS would be ($50 ÷ $200) × 100 = 25%.
Why ACoS is Critical
- Measures cost efficiency on a per-campaign or product level
- Commonly used on platforms like Amazon Sponsored Ads
- Lower ACoS often indicates better campaign profitability
A "good" ACoS depends on your profit margins. If your margin is 30%, keeping your ACoS under 30% ensures profit.
The Relationship Between ROAS and ACoS
ROAS and ACoS are two sides of the same coin. They’re inversely related and connected by the formula:
ACoS = 1 ÷ ROAS
For example:
- A ROAS of 5X equals an ACoS of 20%.
- A ROAS of 2X equals an ACoS of 50%.
The choice between tracking ROAS or ACoS often depends on the advertising platform. Google Ads is ROAS-centric, while Amazon sellers prioritize ACoS for its granular focus on profitability.
Introducing TACoS
To look beyond individual campaigns, TACoS (Total Advertising Cost of Sale) provides a holistic view by measuring ad spend's impact on total business revenue, including organic sales.
Formula
TACoS = Ad Spend ÷ Total Sales
For example, if you spent $100 on ads and your total sales (ad + organic) amounted to $500, your TACoS would be $100 ÷ $500 = 20%.
Why TACoS Matters?
- Tracks the broader impact of advertising
- Reveals how ad spend contributes to organic growth
- Keeps a check on the balance between ad-driven and organic revenue
A declining TACoS is often a good sign, as it shows growing organic sales while maintaining ad efficiency.
Benchmarks for ROAS, ACoS, and TACoS
ROAS
- Average benchmark: 4X or higher
- Industries with high margins may aim for 10X ROAS, while lower-margin businesses might settle for 3X.
ACoS
- Good benchmark: 20-30%, but targets vary based on profit margins.
- Higher ACoS can be acceptable for goals like brand awareness or launching a new product.
TACoS
- A healthy TACoS is typically around 5-15%, as it reflects a balance between ad-driven and organic growth.
Download our ROAS/ACoS Tracker Template — plug in your spend, sales, and goals to instantly visualize real profit vs. waste.

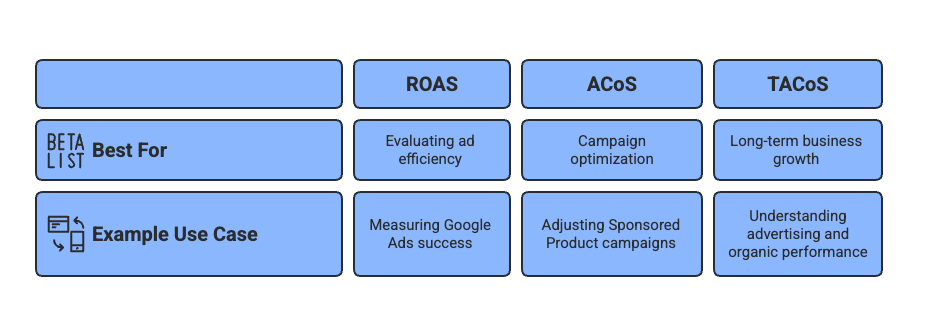
When to Use ROAS, ACoS, or TACoS
Not sure which metric to focus on? Here’s a quick breakdown of when to use each one:
Real World Examples
Example 1
An e-commerce business runs a Google Ads campaign targeting holiday shoppers. They spend $1,000 on ads and earn $6,000 in sales. Their ROAS? 6X, signaling a highly profitable campaign.
Example 2
An Amazon seller spends $300 on Sponsored Products ads, generating $1,200 in sales. Their ACoS is 25%, which is below their 30% profit margin, ensuring profitability.
Example 3
A DTC brand spends $500 on ads and earns $2,000 in total sales (including organic). Their TACoS is 25%, indicating that ads are driving both paid and organic growth.
Turn Metrics Into Success
ROAS, ACoS, and TACoS are powerful tools for optimizing advertising performance, but their magic lies in consistent tracking and analysis. Use ROAS to measure ad efficiency, ACoS for campaign-specific profitability, and TACoS to understand long-term growth.
Are you ready to supercharge your campaigns? Start calculating your metrics today. Need help with analysis? Tools like Ours can simplify your data insights, helping you make smarter decisions and drive profitability.
Book a strategy call with our ad team — we’ll audit your campaign math and show where your ROI is slipping (and how to fix it).
Spend

🔄 Recap: ROAS, ACoS & TACoS
- ROAS = Revenue ÷ Ad Spend
- ACoS = Ad Spend ÷ Sales
- TACoS includes organic + paid impact
- Choose based on your goal: profit, scale, or blended growth
- Use benchmarks to track real efficiency
Frequently Asked Questions?
ROAS (Return on Ad Spend) indicates the expected revenue generated from an advertising campaign, while ACoS (Advertising Cost of Sales) represents the proportion of ad spend in relation to total sales. Both metrics assess the performance of advertising efforts, but they express the data in different formats: ROAS as a revenue-to-spend ratio and ACoS as a spend-to-revenue percentage.
To determine ACoS, divide your total ad expenditure by your ad-generated revenue and multiply by 100. For ROAS, divide your ad revenue by your total ad spend. ACoS Formula: ACoS = (Total Ad Spend / Total Ad Revenue) × 100 ROAS Formula: ROAS = Total Ad Revenue / Total Ad Spend Example: If you invest $100 in ads and generate $500 in revenue, ACoS would be: ACoS = ($100 / $500) × 100 = 20%. And ROAS would be: ROAS = $500 / $100 = 5.
ACoS (Advertising Cost of Sales) and MER (Marketing Efficiency Ratio) are both essential for assessing marketing performance, but they measure distinct aspects. ACoS calculates the ad spend as a percentage of total sales, while MER evaluates overall marketing effectiveness by comparing total revenue to total marketing costs.
A 400% ROAS means that for every $1 invested in advertising, $4 in revenue is generated. Essentially, a 400% ROAS represents a 4:1 ratio (i.e., $4 earned for every $1 spent). For example, if you spend $1,000 on ads, a 400% ROAS means you earn $4,000 in return.