.png)


Your PPC dashboard looks healthy enough. ACoS isn't alarming. Spend is moving. Sales are coming in. But you still can't answer the questions that actually determine whether the account is scaling profitably.
Are you bidding on the search terms shoppers use most, or just the ones your team guessed were important months ago? Which products do buyers compare against yours before they convert? What do they buy alongside your ASINs? And are you targeting the customer you think you have, or the one Amazon's own data says is already buying?
That's where amazon brand analytics stops being a nice extra and starts becoming operationally important. Most sellers open the reports, skim a few charts, and go back to campaign management. That's a mistake. The value isn't in reading the dashboards. The value is in converting Amazon's first-party behavioral data into bid changes, audience builds, listing updates, bundle decisions, and cleaner TACoS.
Table of Contents
- Top Search Terms and Search Query Data
- Market Basket Analysis
- Item Comparison and Alternate Purchase
- Customer Demographics
- Repeat Purchase Behavior
- Finding demand competitors haven't locked up
- Using comparison behavior to sharpen listings
- Portfolio discipline matters
Beyond Ad Spend The Data Hiding in Plain Sight
A common pattern shows up in mature Amazon accounts. Teams spend hours inside Campaign Manager, trimming bids, adding negatives, adjusting placements, and defending a target ACoS. Meanwhile, the bigger growth signals sit untouched in Brand Analytics.
We've seen accounts where ad metrics looked controlled, but the brand was still making expensive decisions. They pushed terms that had weak organic purchase behavior, ignored product pairings that should have informed Sponsored Display targeting, and kept writing copy for the wrong buyer profile. None of that is visible in standard ad reports alone.
The problem isn't a lack of data. It's a lack of connected data.
Practical rule: If your PPC decisions come only from PPC reports, you're optimizing execution without understanding buying behavior.
Amazon Brand Analytics gives you that missing layer. It shows how shoppers search, what they click, what they compare, what they buy together, and who they are in aggregate. That changes the job. Instead of asking, “Which keyword spent too much yesterday?” you start asking, “Which queries deserve more budget because the brand already has demand there, and which queries are absorbing spend without reinforcing the brand?”
Three examples make the point:
- Keyword selection: A term may convert in ads, but if Brand Analytics shows weak broader brand share on that query, you may need better content and stronger ranking support, not just higher bids.
- Cross-sell logic: If shoppers regularly buy your product with another ASIN, that's a targeting clue, not just an interesting observation.
- Audience fit: If your demographic mix differs from your assumed buyer persona, Sponsored Brands and Sponsored Display strategy should change with it.
Sellers who treat amazon brand analytics as a reporting archive miss its real use. The winning move is operational. Read the signal, then push it into campaigns, listings, and catalog strategy fast.
What Is Amazon Brand Analytics and How to Access It
Amazon Brand Analytics is Amazon's first-party analytics environment for enrolled brand owners. It was launched for Brand Registry members to provide aggregated data on customer behavior, and its dashboards track organic metrics such as impressions, clicks, cart adds, and conversion rates across the shopping funnel, separate from PPC ad hits, according to Amazon's overview of Brand Analytics. That distinction matters because it lets you evaluate demand and shopping behavior without mixing in ad-attributed noise.
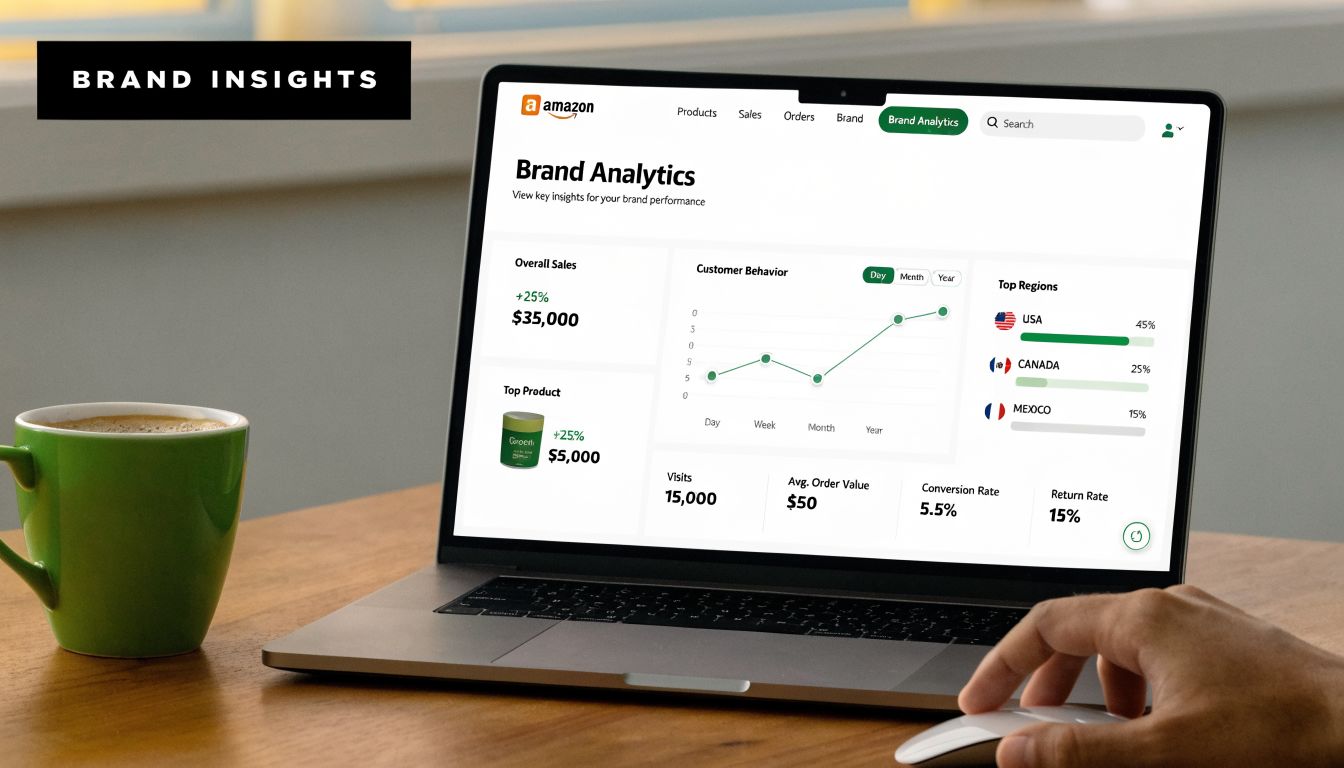
For brand operators, this is the closest thing to a platform-native source of truth for how shoppers discover and evaluate products on Amazon. In a marketplace where third-party sellers reached 62% of total units sold in 2025 per Amazon's Brand Analytics blog, the brands that win are usually the ones that use Amazon's own customer behavior data to tighten listing strategy and campaign direction, not just bid mechanics.
Access starts with Brand Registry
This part is simple, but it's mandatory.
You need Brand Registry access. No Brand Registry, no Brand Analytics. That requirement exists because Amazon is giving brand owners aggregated and anonymized visibility into brand-level customer behavior. Amazon needs to know you're authorized to see it.
The practical path is:
- Use a Professional selling account
- Enroll the brand in Amazon Brand Registry
- Log in to Seller Central
- Select Brand Analytics from the Brands menu
If you manage multiple brands, make sure user permissions are mapped correctly. Access problems are often administrative, not technical.
What ABA is good for
Most sellers think of ABA as a keyword tool. That undersells it badly. It's better to think of it as a decision system for three areas:
- Organic search performance: You can inspect how products move through the shopping funnel outside PPC reporting.
- Customer behavior: You can see what buyers search, compare, and purchase alongside your products.
- Strategic planning: You can use query, demographic, and basket data to guide campaign structure and catalog decisions.
ABA doesn't replace advertising reports. It gives context those reports can't provide.
That's why serious operators don't isolate it inside brand management. They feed it directly into PPC, merchandising, and creative decisions.
Deconstructing the 5 Essential Brand Analytics Reports
The biggest mistake sellers make inside amazon brand analytics is opening reports without knowing what business question each one answers. When that happens, teams collect observations and leave with no action plan. A better approach is to map each report to a decision.
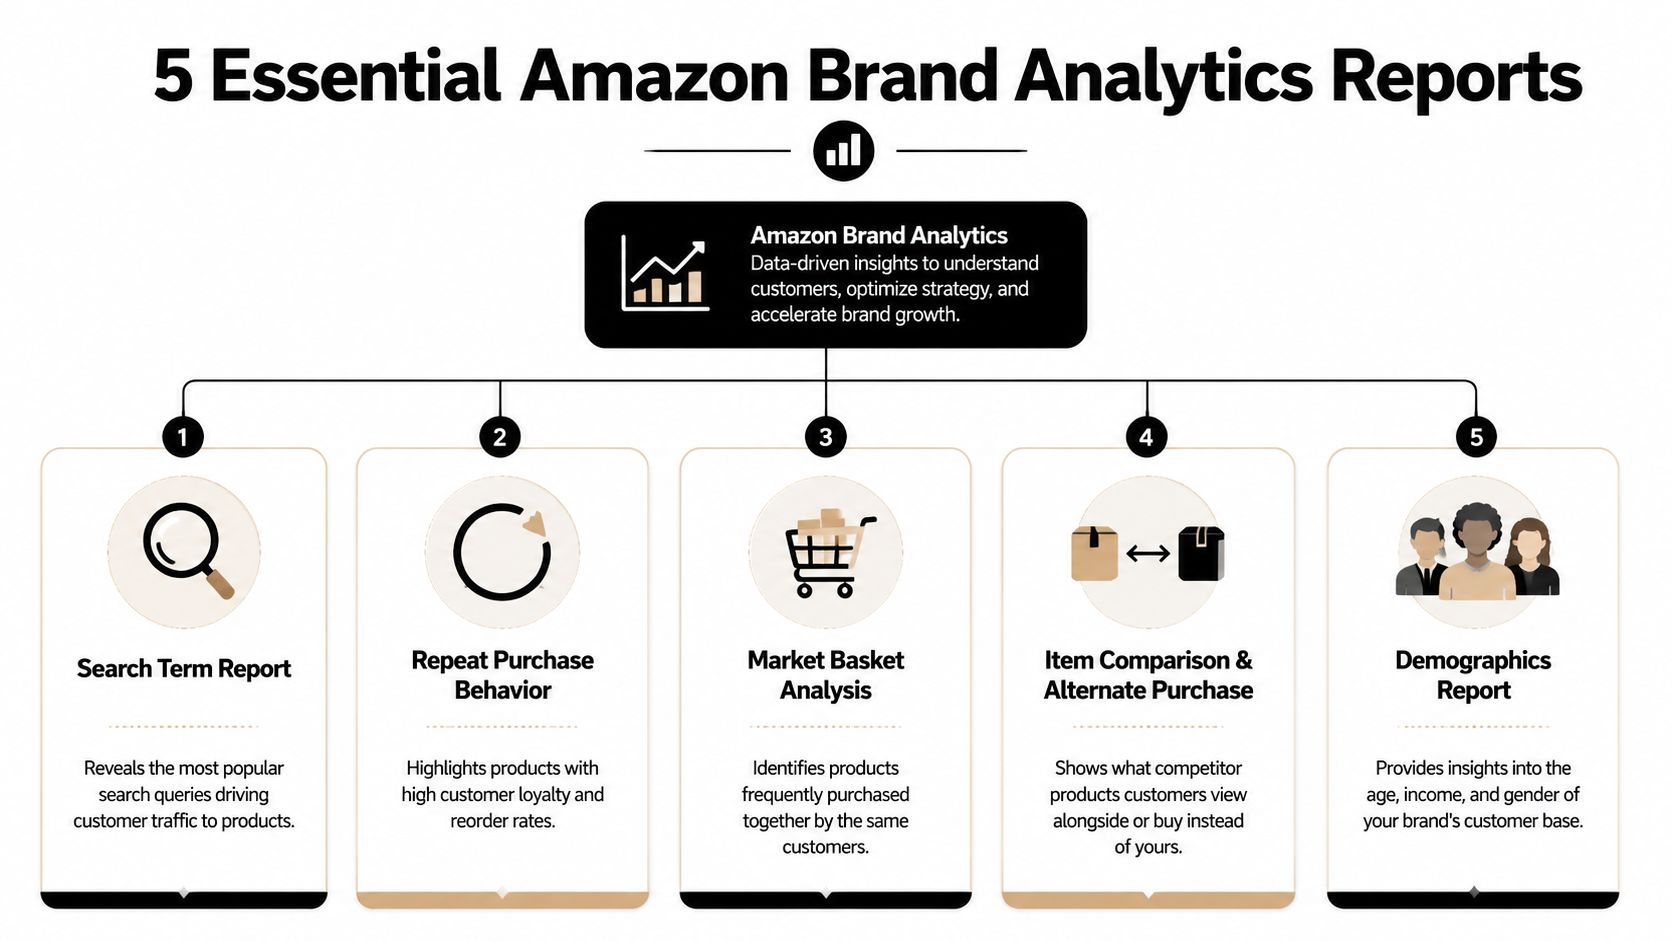
Top Search Terms and Search Query Data
Here, you pressure-test your keyword strategy against actual shopping behavior.
The Top Search Terms view tells you which queries matter most across Amazon. The key metric here is Search Frequency Rank, or SFR. Lower numbers mean higher popularity. That alone helps separate major demand drivers from niche terms. You also get Click Share and Conversion Share, which show which products and brands are winning attention and purchases after a query is searched.
Search Query data adds another useful layer. It helps you evaluate brand performance on the queries that lead shoppers into your catalog, including how much of the click and purchase activity your brand captures relative to the wider market.
Use this report when you need to answer:
- Are we emphasizing the right search terms in campaigns and listings?
- Which queries drive traffic but not enough downstream purchases?
- Where is the brand visible, but still losing share?
Market Basket Analysis
This report answers a different question. What do customers buy with our product?
That matters for more than bundling. It matters for targeting logic. If a complementary ASIN repeatedly appears with yours, that's a signal about buyer intent, adjacent demand, and potential product targeting opportunities.
A core metric here is Combination %. It shows how often your product is bought with another item. According to this breakdown of ABA metrics from ZonGuru, a 15% Combination % signals a strong bundling opportunity, and the same source notes that these data points become available when at least 100 unique customers are tracked. That threshold matters because it affects when some reports become usable at all.
Here's a key takeaway. Market Basket isn't just for merchandising teams. PPC managers should be in it constantly.
Item Comparison and Alternate Purchase
This report shows where your product sits inside the consideration set.
If customers view your listing and then compare it to other products within a short window, Amazon surfaces those competing ASINs. It also shows what they purchased instead. That gives you direct evidence of where your listing loses the argument.
This report is especially useful when:
- Conversion rate is soft despite healthy traffic
- Sponsored Product campaigns are driving detail page visits but purchase share lags
- Reviews, price, packaging, or hero image positioning may be misaligned with what shoppers are comparing
If shoppers repeatedly compare you to the same few ASINs, those ASINs are your real conversion competitors, whether or not they match your internal competitor list.
Customer Demographics
The Demographics report tells you who is buying in aggregate. That includes age, gender, income, and location patterns, but access depends on volume thresholds. If an ASIN or brand doesn't meet the minimum customer threshold in the selected period, the report won't populate.
For practitioners, the value is straightforward. Demographics can confirm that your assumed audience is correct, or expose that it's wrong. Both outcomes are useful.
A concise way to consider it:
| Report signal | Strategic meaning | Likely action |
|---|---|---|
| Age skew is different from your creative assumptions | Your messaging may be off | Rework Sponsored Brands video hooks and listing copy |
| Income mix differs from your price positioning | Your value framing may be wrong | Adjust premium vs practical positioning |
| Location concentration appears in major regions | Demand may cluster operationally | Review inventory, seasonality, and regional messaging |
Repeat Purchase Behavior
This report shows whether customers come back. For replenishable or habit-driven products, that's one of the most important indicators in the account. For one-time purchase categories, it's still helpful because it tells you which ASINs deserve loyalty-focused support and which ones need pure acquisition economics.
Repeat Purchase Behavior helps answer:
- Which ASINs justify broader top-of-funnel spend?
- Which products are retention assets inside the catalog?
- Which launches are producing first orders but not repeat behavior?
Products with stronger repeat dynamics often deserve a different advertising posture than products that need constant reacquisition.
From Insight to Action PPC Strategies from ABA Data
Most amazon brand analytics content stops one step too early. It explains what the reports mean, then leaves the operator to translate them into PPC changes. That translation is where profit is made or lost.

A common strategic gap is failing to integrate Demographics and Market Basket data into paid media. According to this analysis of underused ABA reports, aligning Sponsored Brands campaigns to actual customer demographics and using Market Basket pairs as targeting or negative signals can lower ACoS by 15% to 25%. That's a meaningful difference because it addresses a problem many teams miss. Flat ROAS often comes from targeting assumptions that were never validated against buyer behavior.
When search data should change bids
Search data should influence more than keyword expansion. It should shape budget confidence.
If Top Search Terms and query-level behavior show high shopper interest around a term, but your brand's share is weak, that's not an automatic cue to raise bids everywhere. First decide whether the gap is a visibility problem, a relevance problem, or a conversion problem.
Use a simple decision model:
- High search importance, low brand click share: Push controlled testing in manual campaigns and review title, image, and pricing alignment.
- Strong clicks, weak purchases: Don't just increase bids. Audit listing quality and competitor comparison pressure.
- Irrelevant but high-spend search terms in paid reports: Add negatives and stop funding traffic that ABA doesn't support strategically.
For teams trying to tighten efficiency, this is the same discipline behind stronger Amazon ROI strategies that focus on profitable signal quality.
How Market Basket and Demographics should change targeting
Here, ABA becomes immediately actionable.
If Market Basket shows your ASIN is regularly purchased with a complementary item, build product targeting around that relationship. That can mean Sponsored Display audiences, Sponsored Products product targeting, or a virtual bundle test if the catalog supports it.
If the paired ASIN is a product you don't sell, you still have options:
- Target the complementary ASIN to intercept shoppers who already show adjacent intent
- Use the insight in creative so the ad or listing explains compatibility clearly
- Add exclusions or negatives selectively if traffic from that adjacency is wasting spend without conversion
A second workflow comes from Demographics. If your buying audience skews differently than your internal persona, Sponsored Brands messaging and Sponsored Display audience selection need to catch up.
Don't optimize ads for the customer from your kickoff deck. Optimize for the customer Amazon says is already purchasing.
That adjustment is especially valuable when performance stalls even though keyword coverage looks broad. In those accounts, reach isn't the issue. Misalignment is.
A useful companion perspective is below.
When we audit PPC accounts that look “fine” on the surface, the most common ABA-driven fixes are not exotic. They're direct:
- Move budget toward validated search behavior
- Create product targeting from actual basket relationships
- Adjust audience assumptions using demographic reality
- Cut search waste that weakens account-wide efficiency
Raw data doesn't improve ACoS. Decisions do.
Advanced Plays for Listing and Portfolio Strategy
Good operators use amazon brand analytics for PPC. Better operators use it to shape the business around PPC.

Finding demand competitors haven't locked up
The strongest strategic use of search data is demand discovery. By combining Top Search Terms with Search Query Performance, brands can identify high-demand queries where competitors still haven't captured dominant click share. According to this portfolio-focused Amazon analytics analysis, a high search volume keyword where top competitors hold less than 10% click share can indicate a meaningful market gap, and cross-referencing with Demographics can validate whether a new product or positioning angle fits an underserved segment. The same source notes this approach can support 20%+ organic rank gains for sellers scaling to 7-figures.
That's not just a keyword insight. It's a product strategy insight.
When that pattern shows up, ask three questions:
- Does the query describe a use case we don't serve yet?
- Are competitors present but not convincing?
- Can the catalog support a variant, bundle, or new ASIN that matches the gap cleanly?
Using comparison behavior to sharpen listings
Item Comparison data often exposes a listing problem that ad managers can't solve with bids.
If shoppers repeatedly compare your ASIN against products with stronger visual clarity, more obvious value framing, or more relevant feature emphasis, your listing needs to argue harder. That can mean changing the hero image, revising bullet order, tightening the title, or making compatibility and use case language more explicit.
A simple comparison lens works well:
| If shoppers compare against products that win on | Your likely response |
|---|---|
| Clearer packaging or visual differentiation | Rework hero image and secondary images |
| Stronger feature claims | Rewrite bullets and A+ hierarchy |
| Better perceived bundle value | Build bundles or improve offer framing |
For brands trying to connect efficiency metrics to broader growth, this is the same thinking behind a stronger ACoS vs TACoS framework for Amazon decision-making.
Portfolio discipline matters
Multi-brand portfolios create a separate challenge. One brand's keyword expansion can subtly overlap another brand's best query set. One ASIN can steal paid visibility from another without adding true portfolio growth. ABA helps surface those overlaps by showing where search, comparison, and purchase behavior intersect across product lines.
That's why mature portfolio strategy isn't just about launching more products. It's about assigning each product and brand a distinct job inside the category.
Navigating the Limitations and Data Privacy Constraints
Amazon Brand Analytics is useful, but it isn't a live command center and it isn't a customer-level attribution tool. Sellers get into trouble when they expect either one.
What ABA does not give you
The data is aggregated and anonymized. You're not seeing individual customer journeys. You're seeing patterns at the brand, ASIN, and query level that help you make better decisions at scale.
Some reports also depend on eligibility thresholds. Demographics, for example, requires a minimum customer volume before Amazon will display data. If the report is blank, that doesn't always mean there's no insight. It may mean there isn't enough qualifying volume in the selected timeframe.
Where sellers misread the data
The other limitation is timing. ABA is directional and strategic, not minute-by-minute. Use it to guide campaign structure, keyword prioritization, audience alignment, and listing revision. Don't use it as a substitute for daily bid management signals.
A few guardrails keep interpretation clean:
- Check date ranges carefully: Comparing mismatched periods leads to false conclusions.
- Separate signal from action: A weak click share doesn't always mean “bid more.”
- Look for repeated patterns: Single-period anomalies are less useful than recurring behavior.
- Match the report to the decision: Market Basket shouldn't drive the same actions as Item Comparison.
ABA is strongest when you use it to improve the next decision cycle, not when you demand real-time certainty from a strategic dataset.
Building a Data-Driven Optimization Workflow
The best use of amazon brand analytics is rhythmic. Not occasional. Not reactive. It should sit inside the operating cadence of the account the same way search term harvesting, bid adjustments, and placement reviews already do.
A weekly operating rhythm
Every week, review the reports that directly affect campaign execution.
A practical weekly sequence looks like this:
Review search behavior
Pull Top Search Terms and query-level data to identify terms that deserve expansion, terms that need tighter negatives, and terms where visibility exists without enough purchase momentum.Review comparison pressure
Check Item Comparison patterns for ASINs with soft conversion. If the same competing products keep appearing, align the listing and product targeting plan around that reality.Review purchase adjacency
Use Market Basket findings to surface complementary ASINs for Sponsored Display or Sponsored Products product targeting.Check audience fit
If Demographics is available, validate whether campaign messaging still reflects the buyer mix.
For teams building a more complete process, a broader Amazon PPC operating guide for 2025 can help connect this ABA layer to day-to-day campaign management.
A monthly profitability review
Monthly review is where you stop obsessing over isolated ad efficiency and ask whether advertising is improving the business.
That's where TACoS matters. While ACoS measures ad spend against ad-attributed sales, TACoS measures total ad spend against total revenue, which shows whether advertising is supporting profitable expansion or cannibalizing organic sales. According to this TACoS framework for long-term profitability, brands targeting 7 to 8 figure revenue often use a 10% to 12% TACoS target as a strategic north star, while allowing ACoS to run in a 25% to 35% band when paid campaigns are building organic momentum and long-term brand equity.
That's the shift mature brands need to make. ACoS tells you whether a campaign looked efficient. TACoS tells you whether the whole system is getting healthier.
Use ABA to feed that system:
- Search data informs demand capture
- Comparison data informs conversion improvement
- Basket data informs cross-sell and targeting expansion
- Demographic data informs audience alignment
- Repeat behavior informs where retention economics justify acquisition investment
When those inputs flow into PPC, listing optimization, and portfolio decisions on a steady cadence, Brand Analytics stops being a dashboard you occasionally check. It becomes part of how you grow profitably.
If your team wants help turning Amazon Brand Analytics into actual PPC actions, Amplivus can help build the workflow, tighten targeting, and connect first-party shopper insights to lower waste and stronger long-term profitability.
Prepared with Outrank

Your PPC dashboard looks healthy enough. ACoS isn't alarming. Spend is moving. Sales are coming in. But you still can't answer the questions that actually determine whether the account is scaling profitably.
Are you bidding on the search terms shoppers use most, or just the ones your team guessed were important months ago? Which products do buyers compare against yours before they convert? What do they buy alongside your ASINs? And are you targeting the customer you think you have, or the one Amazon's own data says is already buying?
That's where amazon brand analytics stops being a nice extra and starts becoming operationally important. Most sellers open the reports, skim a few charts, and go back to campaign management. That's a mistake. The value isn't in reading the dashboards. The value is in converting Amazon's first-party behavioral data into bid changes, audience builds, listing updates, bundle decisions, and cleaner TACoS.
Table of Contents
- Top Search Terms and Search Query Data
- Market Basket Analysis
- Item Comparison and Alternate Purchase
- Customer Demographics
- Repeat Purchase Behavior
- Finding demand competitors haven't locked up
- Using comparison behavior to sharpen listings
- Portfolio discipline matters
Beyond Ad Spend The Data Hiding in Plain Sight
A common pattern shows up in mature Amazon accounts. Teams spend hours inside Campaign Manager, trimming bids, adding negatives, adjusting placements, and defending a target ACoS. Meanwhile, the bigger growth signals sit untouched in Brand Analytics.
We've seen accounts where ad metrics looked controlled, but the brand was still making expensive decisions. They pushed terms that had weak organic purchase behavior, ignored product pairings that should have informed Sponsored Display targeting, and kept writing copy for the wrong buyer profile. None of that is visible in standard ad reports alone.
The problem isn't a lack of data. It's a lack of connected data.
Practical rule: If your PPC decisions come only from PPC reports, you're optimizing execution without understanding buying behavior.
Amazon Brand Analytics gives you that missing layer. It shows how shoppers search, what they click, what they compare, what they buy together, and who they are in aggregate. That changes the job. Instead of asking, “Which keyword spent too much yesterday?” you start asking, “Which queries deserve more budget because the brand already has demand there, and which queries are absorbing spend without reinforcing the brand?”
Three examples make the point:
- Keyword selection: A term may convert in ads, but if Brand Analytics shows weak broader brand share on that query, you may need better content and stronger ranking support, not just higher bids.
- Cross-sell logic: If shoppers regularly buy your product with another ASIN, that's a targeting clue, not just an interesting observation.
- Audience fit: If your demographic mix differs from your assumed buyer persona, Sponsored Brands and Sponsored Display strategy should change with it.
Sellers who treat amazon brand analytics as a reporting archive miss its real use. The winning move is operational. Read the signal, then push it into campaigns, listings, and catalog strategy fast.
What Is Amazon Brand Analytics and How to Access It
Amazon Brand Analytics is Amazon's first-party analytics environment for enrolled brand owners. It was launched for Brand Registry members to provide aggregated data on customer behavior, and its dashboards track organic metrics such as impressions, clicks, cart adds, and conversion rates across the shopping funnel, separate from PPC ad hits, according to Amazon's overview of Brand Analytics. That distinction matters because it lets you evaluate demand and shopping behavior without mixing in ad-attributed noise.
For brand operators, this is the closest thing to a platform-native source of truth for how shoppers discover and evaluate products on Amazon. In a marketplace where third-party sellers reached 62% of total units sold in 2025 per Amazon's Brand Analytics blog, the brands that win are usually the ones that use Amazon's own customer behavior data to tighten listing strategy and campaign direction, not just bid mechanics.
Access starts with Brand Registry
This part is simple, but it's mandatory.
You need Brand Registry access. No Brand Registry, no Brand Analytics. That requirement exists because Amazon is giving brand owners aggregated and anonymized visibility into brand-level customer behavior. Amazon needs to know you're authorized to see it.
The practical path is:
- Use a Professional selling account
- Enroll the brand in Amazon Brand Registry
- Log in to Seller Central
- Select Brand Analytics from the Brands menu
If you manage multiple brands, make sure user permissions are mapped correctly. Access problems are often administrative, not technical.
What ABA is good for
Most sellers think of ABA as a keyword tool. That undersells it badly. It's better to think of it as a decision system for three areas:
- Organic search performance: You can inspect how products move through the shopping funnel outside PPC reporting.
- Customer behavior: You can see what buyers search, compare, and purchase alongside your products.
- Strategic planning: You can use query, demographic, and basket data to guide campaign structure and catalog decisions.
ABA doesn't replace advertising reports. It gives context those reports can't provide.
That's why serious operators don't isolate it inside brand management. They feed it directly into PPC, merchandising, and creative decisions.
Deconstructing the 5 Essential Brand Analytics Reports
The biggest mistake sellers make inside amazon brand analytics is opening reports without knowing what business question each one answers. When that happens, teams collect observations and leave with no action plan. A better approach is to map each report to a decision.
Top Search Terms and Search Query Data
Here, you pressure-test your keyword strategy against actual shopping behavior.
The Top Search Terms view tells you which queries matter most across Amazon. The key metric here is Search Frequency Rank, or SFR. Lower numbers mean higher popularity. That alone helps separate major demand drivers from niche terms. You also get Click Share and Conversion Share, which show which products and brands are winning attention and purchases after a query is searched.
Search Query data adds another useful layer. It helps you evaluate brand performance on the queries that lead shoppers into your catalog, including how much of the click and purchase activity your brand captures relative to the wider market.
Use this report when you need to answer:
- Are we emphasizing the right search terms in campaigns and listings?
- Which queries drive traffic but not enough downstream purchases?
- Where is the brand visible, but still losing share?
Market Basket Analysis
This report answers a different question. What do customers buy with our product?
That matters for more than bundling. It matters for targeting logic. If a complementary ASIN repeatedly appears with yours, that's a signal about buyer intent, adjacent demand, and potential product targeting opportunities.
A core metric here is Combination %. It shows how often your product is bought with another item. According to this breakdown of ABA metrics from ZonGuru, a 15% Combination % signals a strong bundling opportunity, and the same source notes that these data points become available when at least 100 unique customers are tracked. That threshold matters because it affects when some reports become usable at all.
Here's a key takeaway. Market Basket isn't just for merchandising teams. PPC managers should be in it constantly.
Item Comparison and Alternate Purchase
This report shows where your product sits inside the consideration set.
If customers view your listing and then compare it to other products within a short window, Amazon surfaces those competing ASINs. It also shows what they purchased instead. That gives you direct evidence of where your listing loses the argument.
This report is especially useful when:
- Conversion rate is soft despite healthy traffic
- Sponsored Product campaigns are driving detail page visits but purchase share lags
- Reviews, price, packaging, or hero image positioning may be misaligned with what shoppers are comparing
If shoppers repeatedly compare you to the same few ASINs, those ASINs are your real conversion competitors, whether or not they match your internal competitor list.
Customer Demographics
The Demographics report tells you who is buying in aggregate. That includes age, gender, income, and location patterns, but access depends on volume thresholds. If an ASIN or brand doesn't meet the minimum customer threshold in the selected period, the report won't populate.
For practitioners, the value is straightforward. Demographics can confirm that your assumed audience is correct, or expose that it's wrong. Both outcomes are useful.
A concise way to consider it:
| Report signal | Strategic meaning | Likely action |
|---|---|---|
| Age skew is different from your creative assumptions | Your messaging may be off | Rework Sponsored Brands video hooks and listing copy |
| Income mix differs from your price positioning | Your value framing may be wrong | Adjust premium vs practical positioning |
| Location concentration appears in major regions | Demand may cluster operationally | Review inventory, seasonality, and regional messaging |
Repeat Purchase Behavior
This report shows whether customers come back. For replenishable or habit-driven products, that's one of the most important indicators in the account. For one-time purchase categories, it's still helpful because it tells you which ASINs deserve loyalty-focused support and which ones need pure acquisition economics.
Repeat Purchase Behavior helps answer:
- Which ASINs justify broader top-of-funnel spend?
- Which products are retention assets inside the catalog?
- Which launches are producing first orders but not repeat behavior?
Products with stronger repeat dynamics often deserve a different advertising posture than products that need constant reacquisition.
From Insight to Action PPC Strategies from ABA Data
Most amazon brand analytics content stops one step too early. It explains what the reports mean, then leaves the operator to translate them into PPC changes. That translation is where profit is made or lost.
A common strategic gap is failing to integrate Demographics and Market Basket data into paid media. According to this analysis of underused ABA reports, aligning Sponsored Brands campaigns to actual customer demographics and using Market Basket pairs as targeting or negative signals can lower ACoS by 15% to 25%. That's a meaningful difference because it addresses a problem many teams miss. Flat ROAS often comes from targeting assumptions that were never validated against buyer behavior.
When search data should change bids
Search data should influence more than keyword expansion. It should shape budget confidence.
If Top Search Terms and query-level behavior show high shopper interest around a term, but your brand's share is weak, that's not an automatic cue to raise bids everywhere. First decide whether the gap is a visibility problem, a relevance problem, or a conversion problem.
Use a simple decision model:
- High search importance, low brand click share: Push controlled testing in manual campaigns and review title, image, and pricing alignment.
- Strong clicks, weak purchases: Don't just increase bids. Audit listing quality and competitor comparison pressure.
- Irrelevant but high-spend search terms in paid reports: Add negatives and stop funding traffic that ABA doesn't support strategically.
For teams trying to tighten efficiency, this is the same discipline behind stronger Amazon ROI strategies that focus on profitable signal quality.
How Market Basket and Demographics should change targeting
Here, ABA becomes immediately actionable.
If Market Basket shows your ASIN is regularly purchased with a complementary item, build product targeting around that relationship. That can mean Sponsored Display audiences, Sponsored Products product targeting, or a virtual bundle test if the catalog supports it.
If the paired ASIN is a product you don't sell, you still have options:
- Target the complementary ASIN to intercept shoppers who already show adjacent intent
- Use the insight in creative so the ad or listing explains compatibility clearly
- Add exclusions or negatives selectively if traffic from that adjacency is wasting spend without conversion
A second workflow comes from Demographics. If your buying audience skews differently than your internal persona, Sponsored Brands messaging and Sponsored Display audience selection need to catch up.
Don't optimize ads for the customer from your kickoff deck. Optimize for the customer Amazon says is already purchasing.
That adjustment is especially valuable when performance stalls even though keyword coverage looks broad. In those accounts, reach isn't the issue. Misalignment is.
A useful companion perspective is below.
When we audit PPC accounts that look “fine” on the surface, the most common ABA-driven fixes are not exotic. They're direct:
- Move budget toward validated search behavior
- Create product targeting from actual basket relationships
- Adjust audience assumptions using demographic reality
- Cut search waste that weakens account-wide efficiency
Raw data doesn't improve ACoS. Decisions do.
Advanced Plays for Listing and Portfolio Strategy
Good operators use amazon brand analytics for PPC. Better operators use it to shape the business around PPC.
Finding demand competitors haven't locked up
The strongest strategic use of search data is demand discovery. By combining Top Search Terms with Search Query Performance, brands can identify high-demand queries where competitors still haven't captured dominant click share. According to this portfolio-focused Amazon analytics analysis, a high search volume keyword where top competitors hold less than 10% click share can indicate a meaningful market gap, and cross-referencing with Demographics can validate whether a new product or positioning angle fits an underserved segment. The same source notes this approach can support 20%+ organic rank gains for sellers scaling to 7-figures.
That's not just a keyword insight. It's a product strategy insight.
When that pattern shows up, ask three questions:
- Does the query describe a use case we don't serve yet?
- Are competitors present but not convincing?
- Can the catalog support a variant, bundle, or new ASIN that matches the gap cleanly?
Using comparison behavior to sharpen listings
Item Comparison data often exposes a listing problem that ad managers can't solve with bids.
If shoppers repeatedly compare your ASIN against products with stronger visual clarity, more obvious value framing, or more relevant feature emphasis, your listing needs to argue harder. That can mean changing the hero image, revising bullet order, tightening the title, or making compatibility and use case language more explicit.
A simple comparison lens works well:
| If shoppers compare against products that win on | Your likely response |
|---|---|
| Clearer packaging or visual differentiation | Rework hero image and secondary images |
| Stronger feature claims | Rewrite bullets and A+ hierarchy |
| Better perceived bundle value | Build bundles or improve offer framing |
For brands trying to connect efficiency metrics to broader growth, this is the same thinking behind a stronger ACoS vs TACoS framework for Amazon decision-making.
Portfolio discipline matters
Multi-brand portfolios create a separate challenge. One brand's keyword expansion can subtly overlap another brand's best query set. One ASIN can steal paid visibility from another without adding true portfolio growth. ABA helps surface those overlaps by showing where search, comparison, and purchase behavior intersect across product lines.
That's why mature portfolio strategy isn't just about launching more products. It's about assigning each product and brand a distinct job inside the category.
Navigating the Limitations and Data Privacy Constraints
Amazon Brand Analytics is useful, but it isn't a live command center and it isn't a customer-level attribution tool. Sellers get into trouble when they expect either one.
What ABA does not give you
The data is aggregated and anonymized. You're not seeing individual customer journeys. You're seeing patterns at the brand, ASIN, and query level that help you make better decisions at scale.
Some reports also depend on eligibility thresholds. Demographics, for example, requires a minimum customer volume before Amazon will display data. If the report is blank, that doesn't always mean there's no insight. It may mean there isn't enough qualifying volume in the selected timeframe.
Where sellers misread the data
The other limitation is timing. ABA is directional and strategic, not minute-by-minute. Use it to guide campaign structure, keyword prioritization, audience alignment, and listing revision. Don't use it as a substitute for daily bid management signals.
A few guardrails keep interpretation clean:
- Check date ranges carefully: Comparing mismatched periods leads to false conclusions.
- Separate signal from action: A weak click share doesn't always mean “bid more.”
- Look for repeated patterns: Single-period anomalies are less useful than recurring behavior.
- Match the report to the decision: Market Basket shouldn't drive the same actions as Item Comparison.
ABA is strongest when you use it to improve the next decision cycle, not when you demand real-time certainty from a strategic dataset.
Building a Data-Driven Optimization Workflow
The best use of amazon brand analytics is rhythmic. Not occasional. Not reactive. It should sit inside the operating cadence of the account the same way search term harvesting, bid adjustments, and placement reviews already do.
A weekly operating rhythm
Every week, review the reports that directly affect campaign execution.
A practical weekly sequence looks like this:
Review search behavior
Pull Top Search Terms and query-level data to identify terms that deserve expansion, terms that need tighter negatives, and terms where visibility exists without enough purchase momentum.Review comparison pressure
Check Item Comparison patterns for ASINs with soft conversion. If the same competing products keep appearing, align the listing and product targeting plan around that reality.Review purchase adjacency
Use Market Basket findings to surface complementary ASINs for Sponsored Display or Sponsored Products product targeting.Check audience fit
If Demographics is available, validate whether campaign messaging still reflects the buyer mix.
For teams building a more complete process, a broader Amazon PPC operating guide for 2025 can help connect this ABA layer to day-to-day campaign management.
A monthly profitability review
Monthly review is where you stop obsessing over isolated ad efficiency and ask whether advertising is improving the business.
That's where TACoS matters. While ACoS measures ad spend against ad-attributed sales, TACoS measures total ad spend against total revenue, which shows whether advertising is supporting profitable expansion or cannibalizing organic sales. According to this TACoS framework for long-term profitability, brands targeting 7 to 8 figure revenue often use a 10% to 12% TACoS target as a strategic north star, while allowing ACoS to run in a 25% to 35% band when paid campaigns are building organic momentum and long-term brand equity.
That's the shift mature brands need to make. ACoS tells you whether a campaign looked efficient. TACoS tells you whether the whole system is getting healthier.
Use ABA to feed that system:
- Search data informs demand capture
- Comparison data informs conversion improvement
- Basket data informs cross-sell and targeting expansion
- Demographic data informs audience alignment
- Repeat behavior informs where retention economics justify acquisition investment
When those inputs flow into PPC, listing optimization, and portfolio decisions on a steady cadence, Brand Analytics stops being a dashboard you occasionally check. It becomes part of how you grow profitably.
If your team wants help turning Amazon Brand Analytics into actual PPC actions, Amplivus can help build the workflow, tighten targeting, and connect first-party shopper insights to lower waste and stronger long-term profitability.
Prepared with Outrank
Frequently Asked Questions?
